
Do visitors from Instagram click differently than those from Google? And which clicks lead to a purchase? This article shows you how to filter the heatmap by source and color it by revenue.
Last updated: October 4, 2026
Requirements
You have opened Live Heatmaps.
For revenue you need a goal with a value, for example purchases. You can read how to create goals under Conversions.
Filter by source
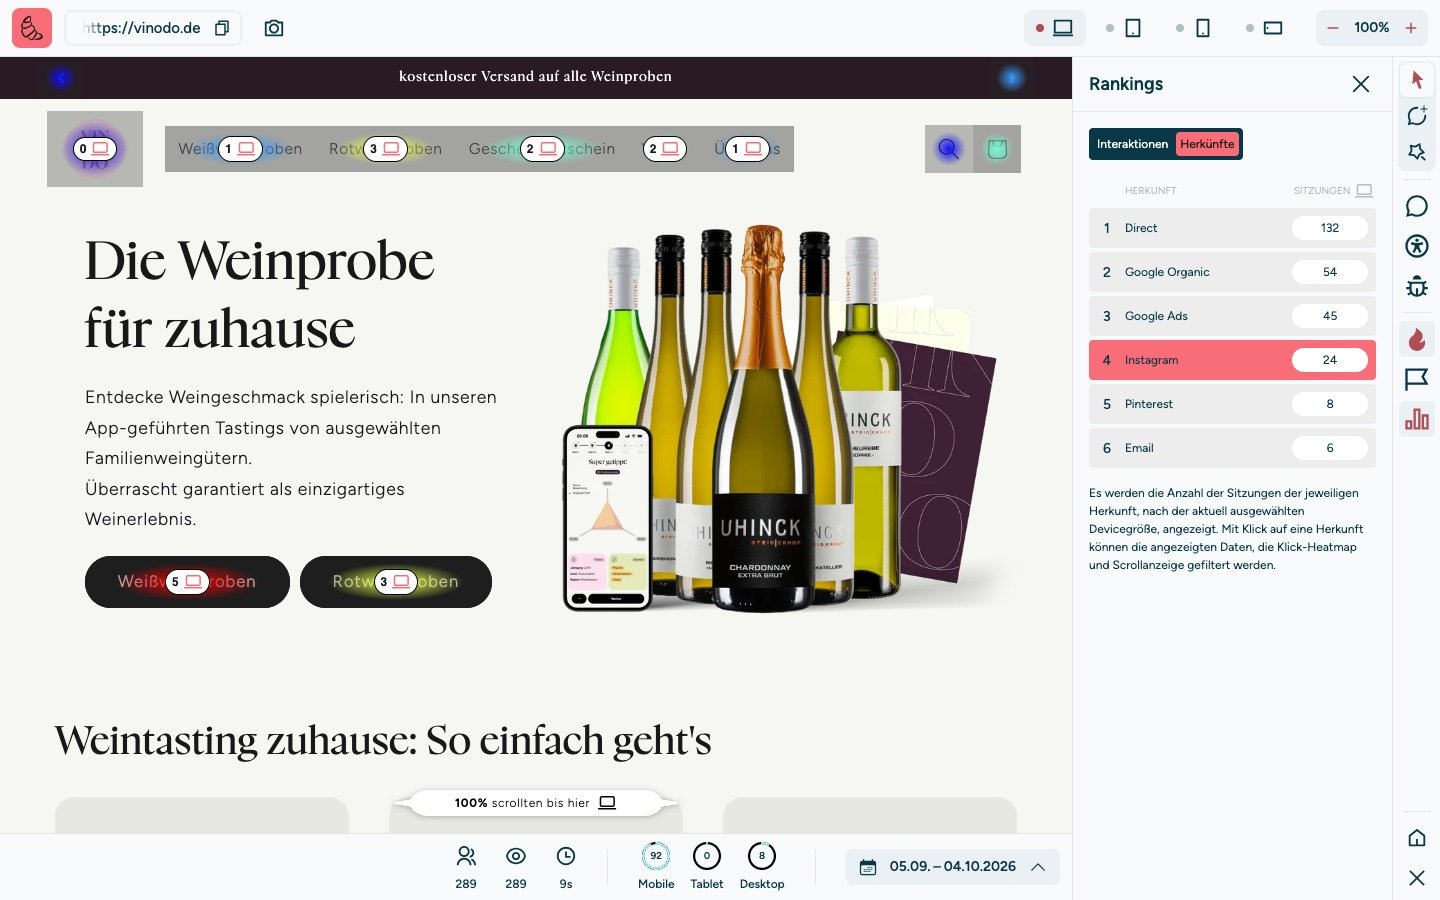
Click “Rankings” on the right edge and then the “Origins” tab. There you see where the visits to this page came from, for example direct, via Google or via Instagram.
Click a source. It is marked in red, and the heatmap, the scroll depth and the numbers at the bottom now only show visits from there. A second click removes the filter again.
The Goals panel
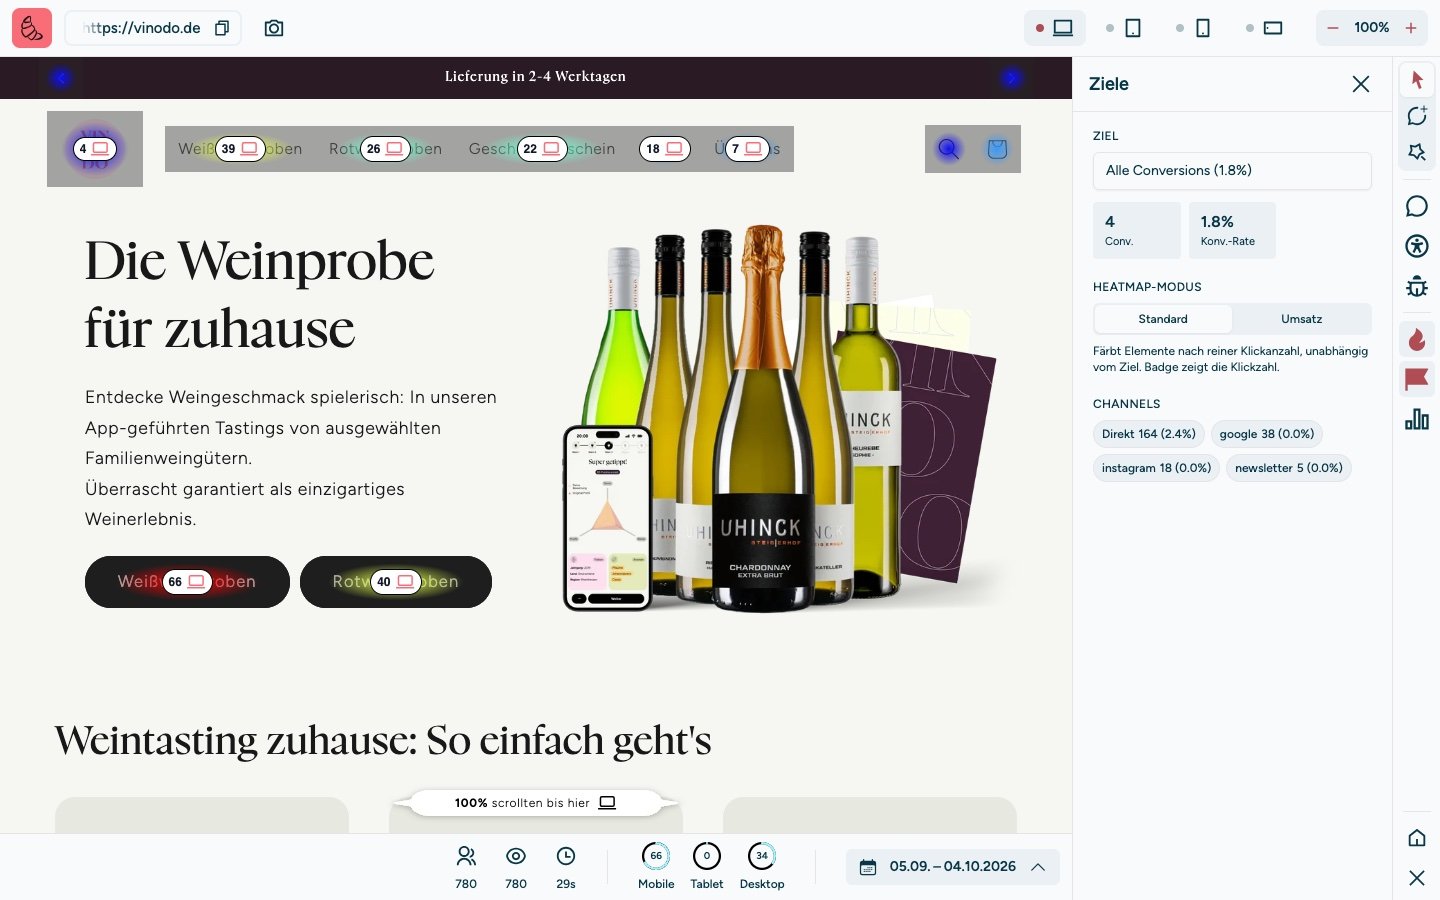
Click the flag icon “Goals” on the right edge. Under “Goal”, choose one of your goals or “All conversions”. Below it you see how many visits to this page reached the goal and how high the conversion rate is.
Under “Channels” you see for each source how many visits came from there and what percentage of them reached the goal. Clicking a channel filters the heatmap to this source. You can also choose several.
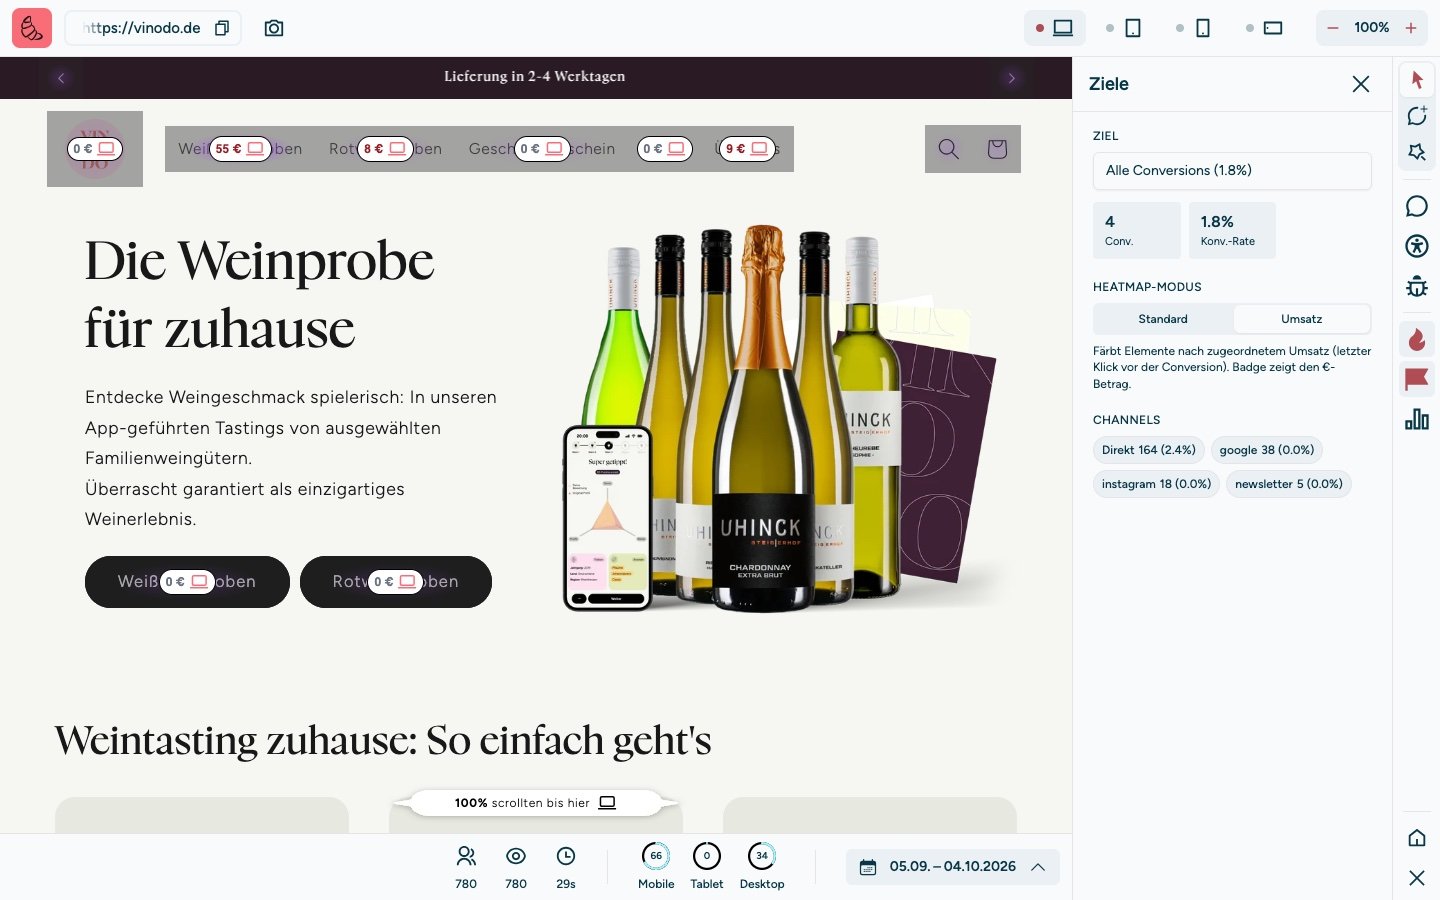
Heatmap by revenue
Under “Heatmap mode” you switch between two views:
“Standard”: the colors and numbers show the clicks, whether or not a goal was reached afterwards.
“Revenue”: the elements show the revenue in euros attributed to them.
The revenue is attributed to the last click on this page before the purchase. On vinodo.de, for example, the menu item “Weißweinproben” (white wine tastings) shows €55: visits whose last click was there went on to buy for €55.
Once you have used the “Goals” panel, the popup shows you more when you hover: how often the element was clicked, by how many visits and how many of those reached the goal.