
Live Heatmaps show you directly on your website what visitors click. This article shows you how to open them and what you see at first glance.
Last updated: October 4, 2026
Requirements
The snippet is installed on your website.
You use Google Chrome and have installed the sitebrunch extension.
Open Live Heatmaps
In the menu under “User Experience”, click “Live Heatmaps”. The small arrow next to it tells you that the heatmaps open in a new tab, not in the dashboard.
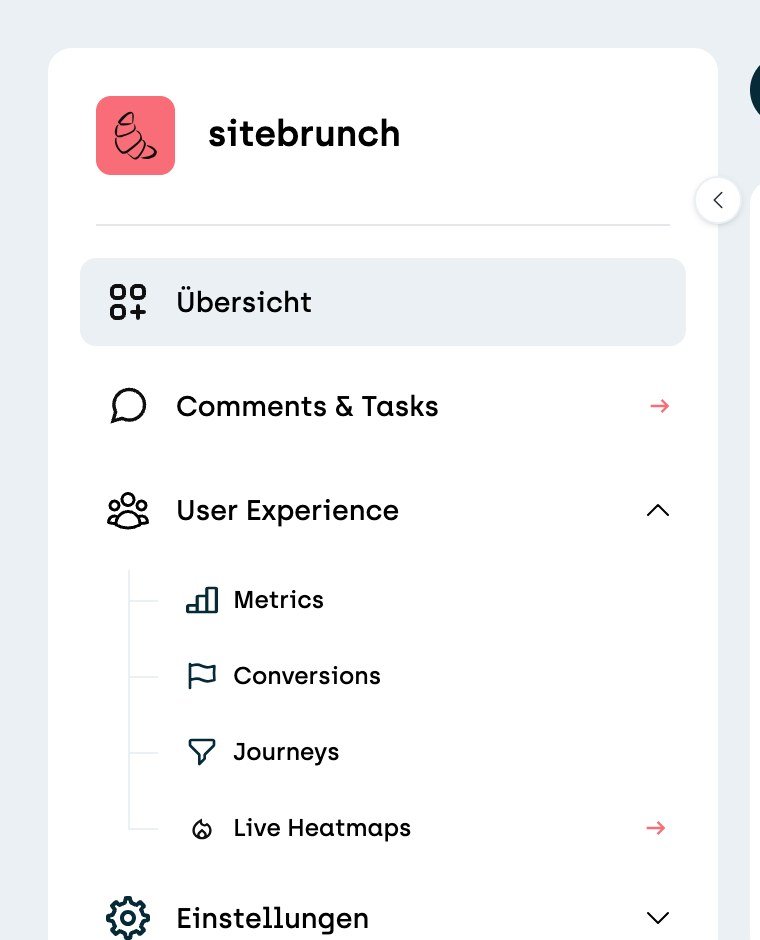
For this you need the sitebrunch extension for Chrome. If it is not installed yet, sitebrunch asks you about it the first time and takes you to the installation with “Go to extension store”.
What you see
Your real website opens in the new tab, with sitebrunch around it. The heatmap is already turned on. Every clickable element, meaning links, buttons, menu items and form fields, gets a number. It tells you how often the element was clicked in the selected period.
The color shows you where the most happens: red marks the elements with the most clicks, followed by yellow, green and blue. Elements without clicks are gray and show a 0.
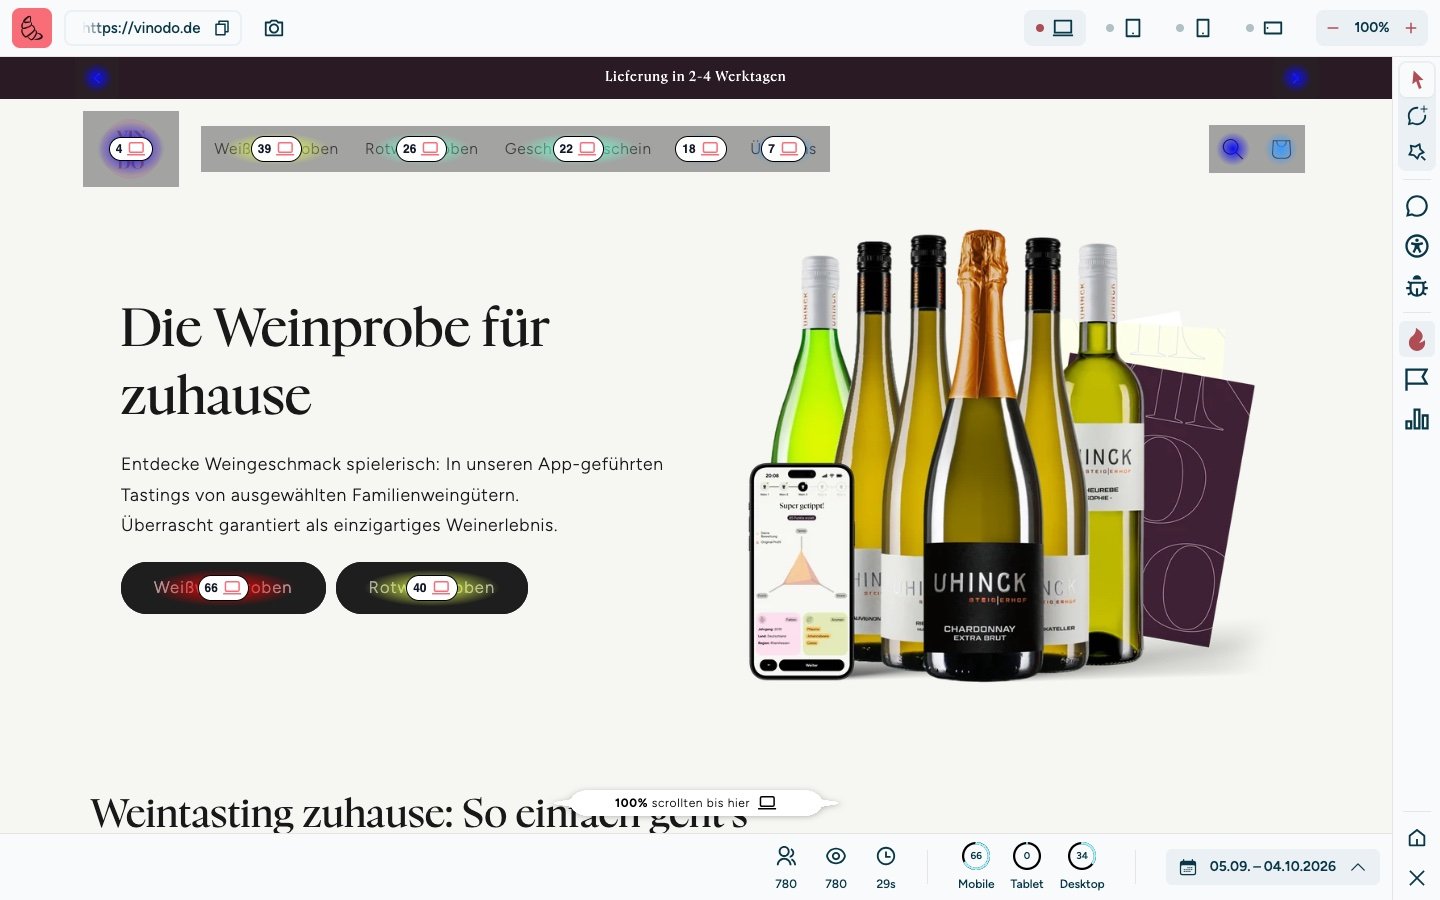
On vinodo.de you see right away: the large “Weißweinproben” (white wine tastings) button on the home page is clicked more often than the same item in the menu. So the home page leads well to the most important page.
The bar at the bottom
At the bottom, sitebrunch sums up the page for the period:
Visitors, page views and the average visit duration.
What percentage of visits were on a phone, a tablet and a computer.
On the right, the period.
Change the period
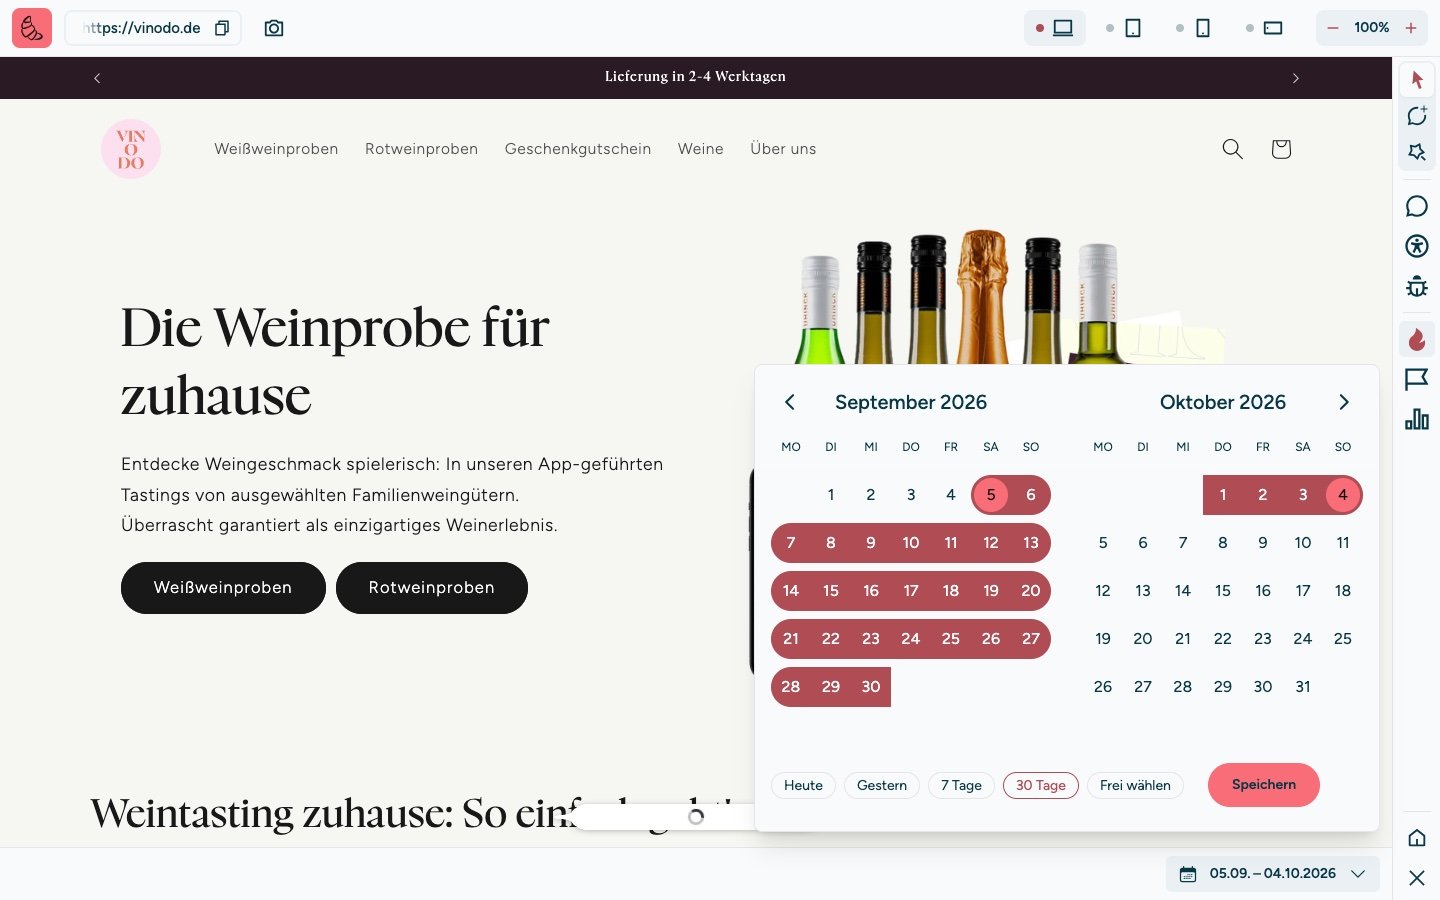
Click the period at the bottom right. Choose “Today”, “Yesterday”, “7 Days” or “30 Days”, or select a period yourself in the calendar with “Custom range”. Then click “Save”.
Turn the heatmap off and on
On the right edge you find the flame icon “Heatmap”. Use it to hide the heatmap, for example when you want to look at the page without colors. A second click shows it again.