Live Heatmaps
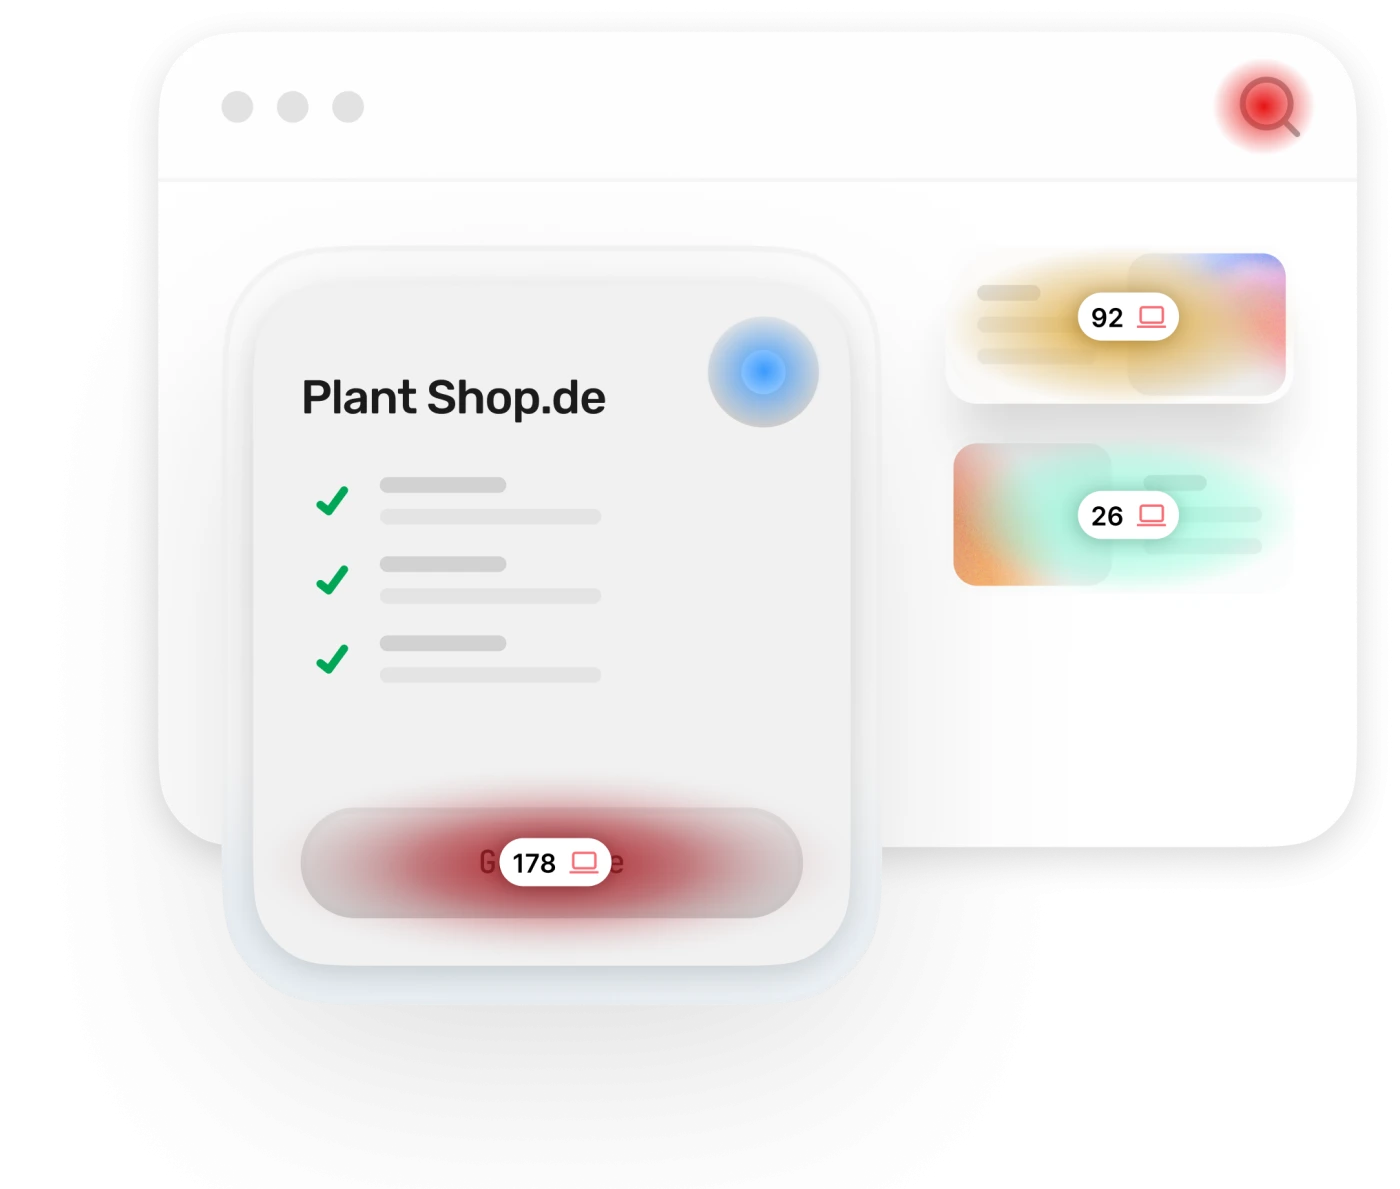
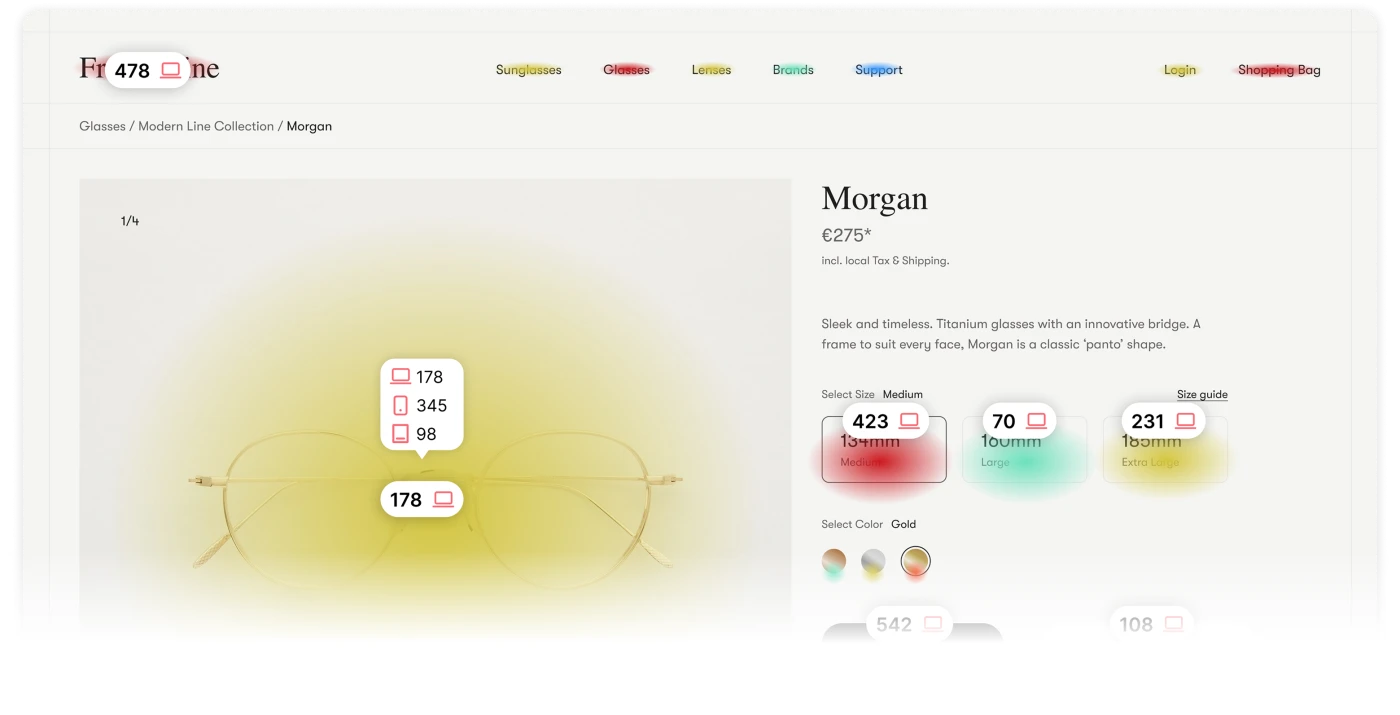
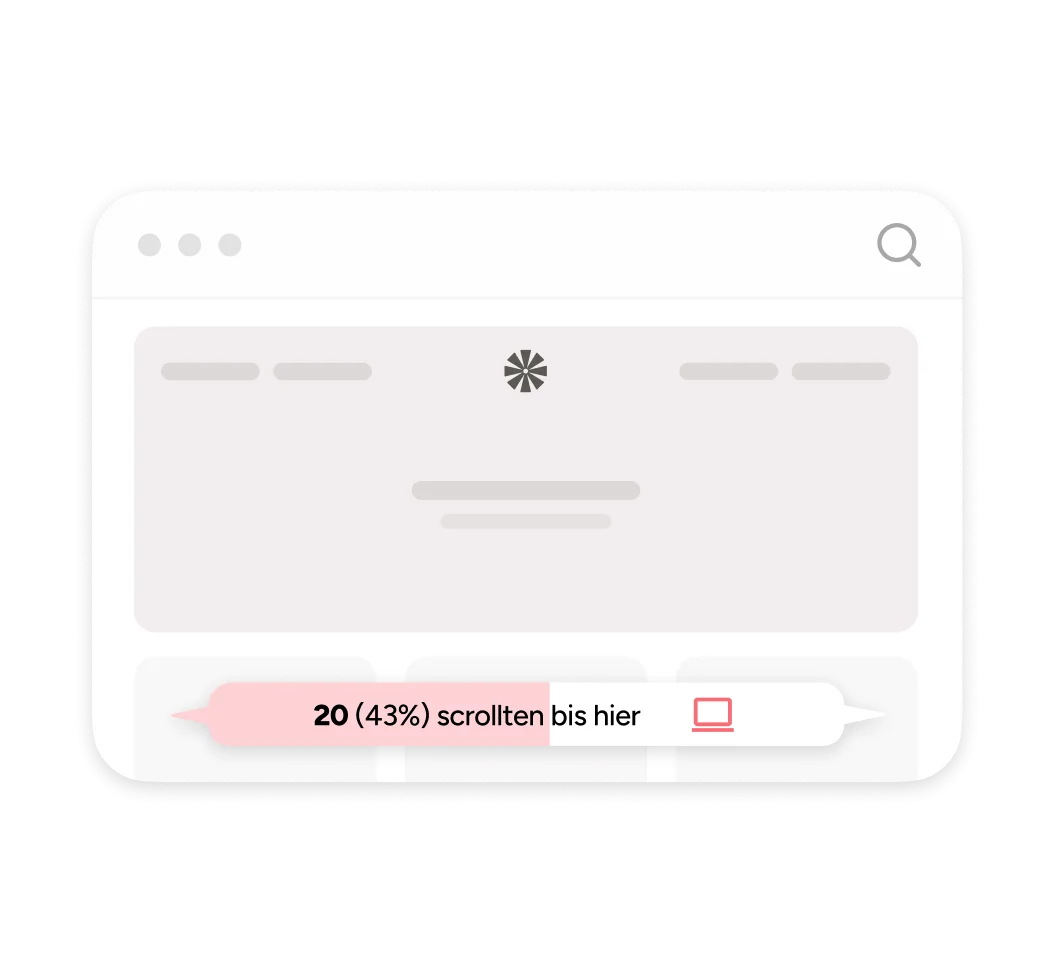
The heatmaps show you which areas of your website get the most attention, for data-driven optimization without guesswork.
More about heatmapsUnderstand user behavior on your website in real time: click heatmaps, user journeys, and metrics reveal optimization potential instantly.
Analyze your visitors' behavior with powerful, privacy-compliant tools.
The heatmaps show you which areas of your website get the most attention, for data-driven optimization without guesswork.
More about heatmaps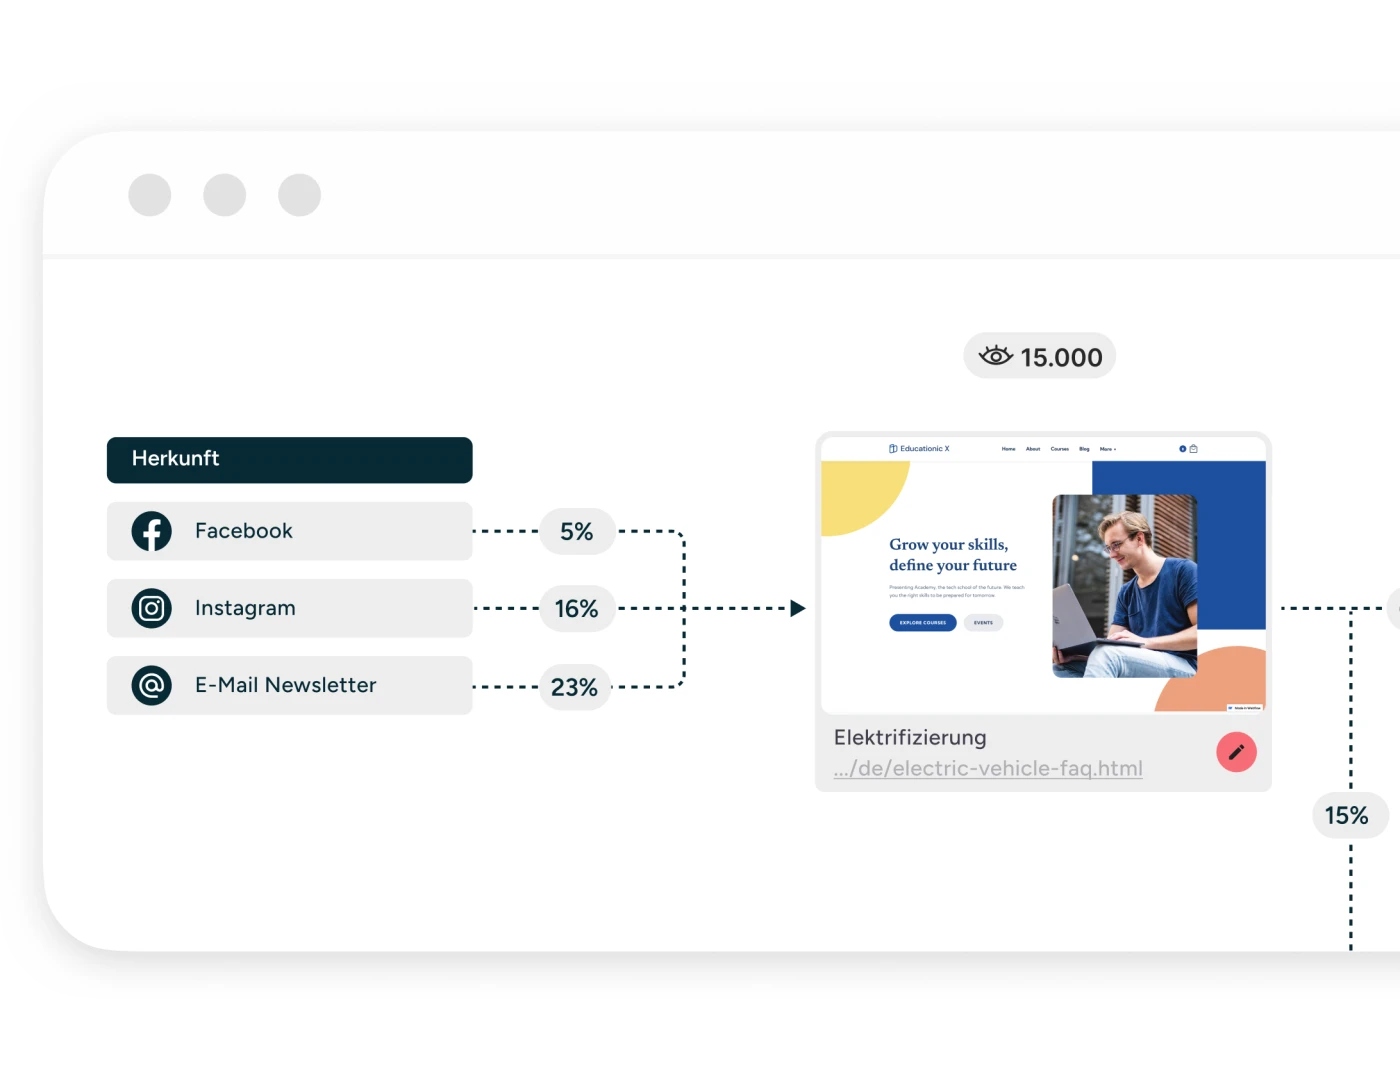
See how visitors navigate your site and analyze the performance of your campaigns at the same time, for an optimal user experience and targeted marketing strategies.
More about user flows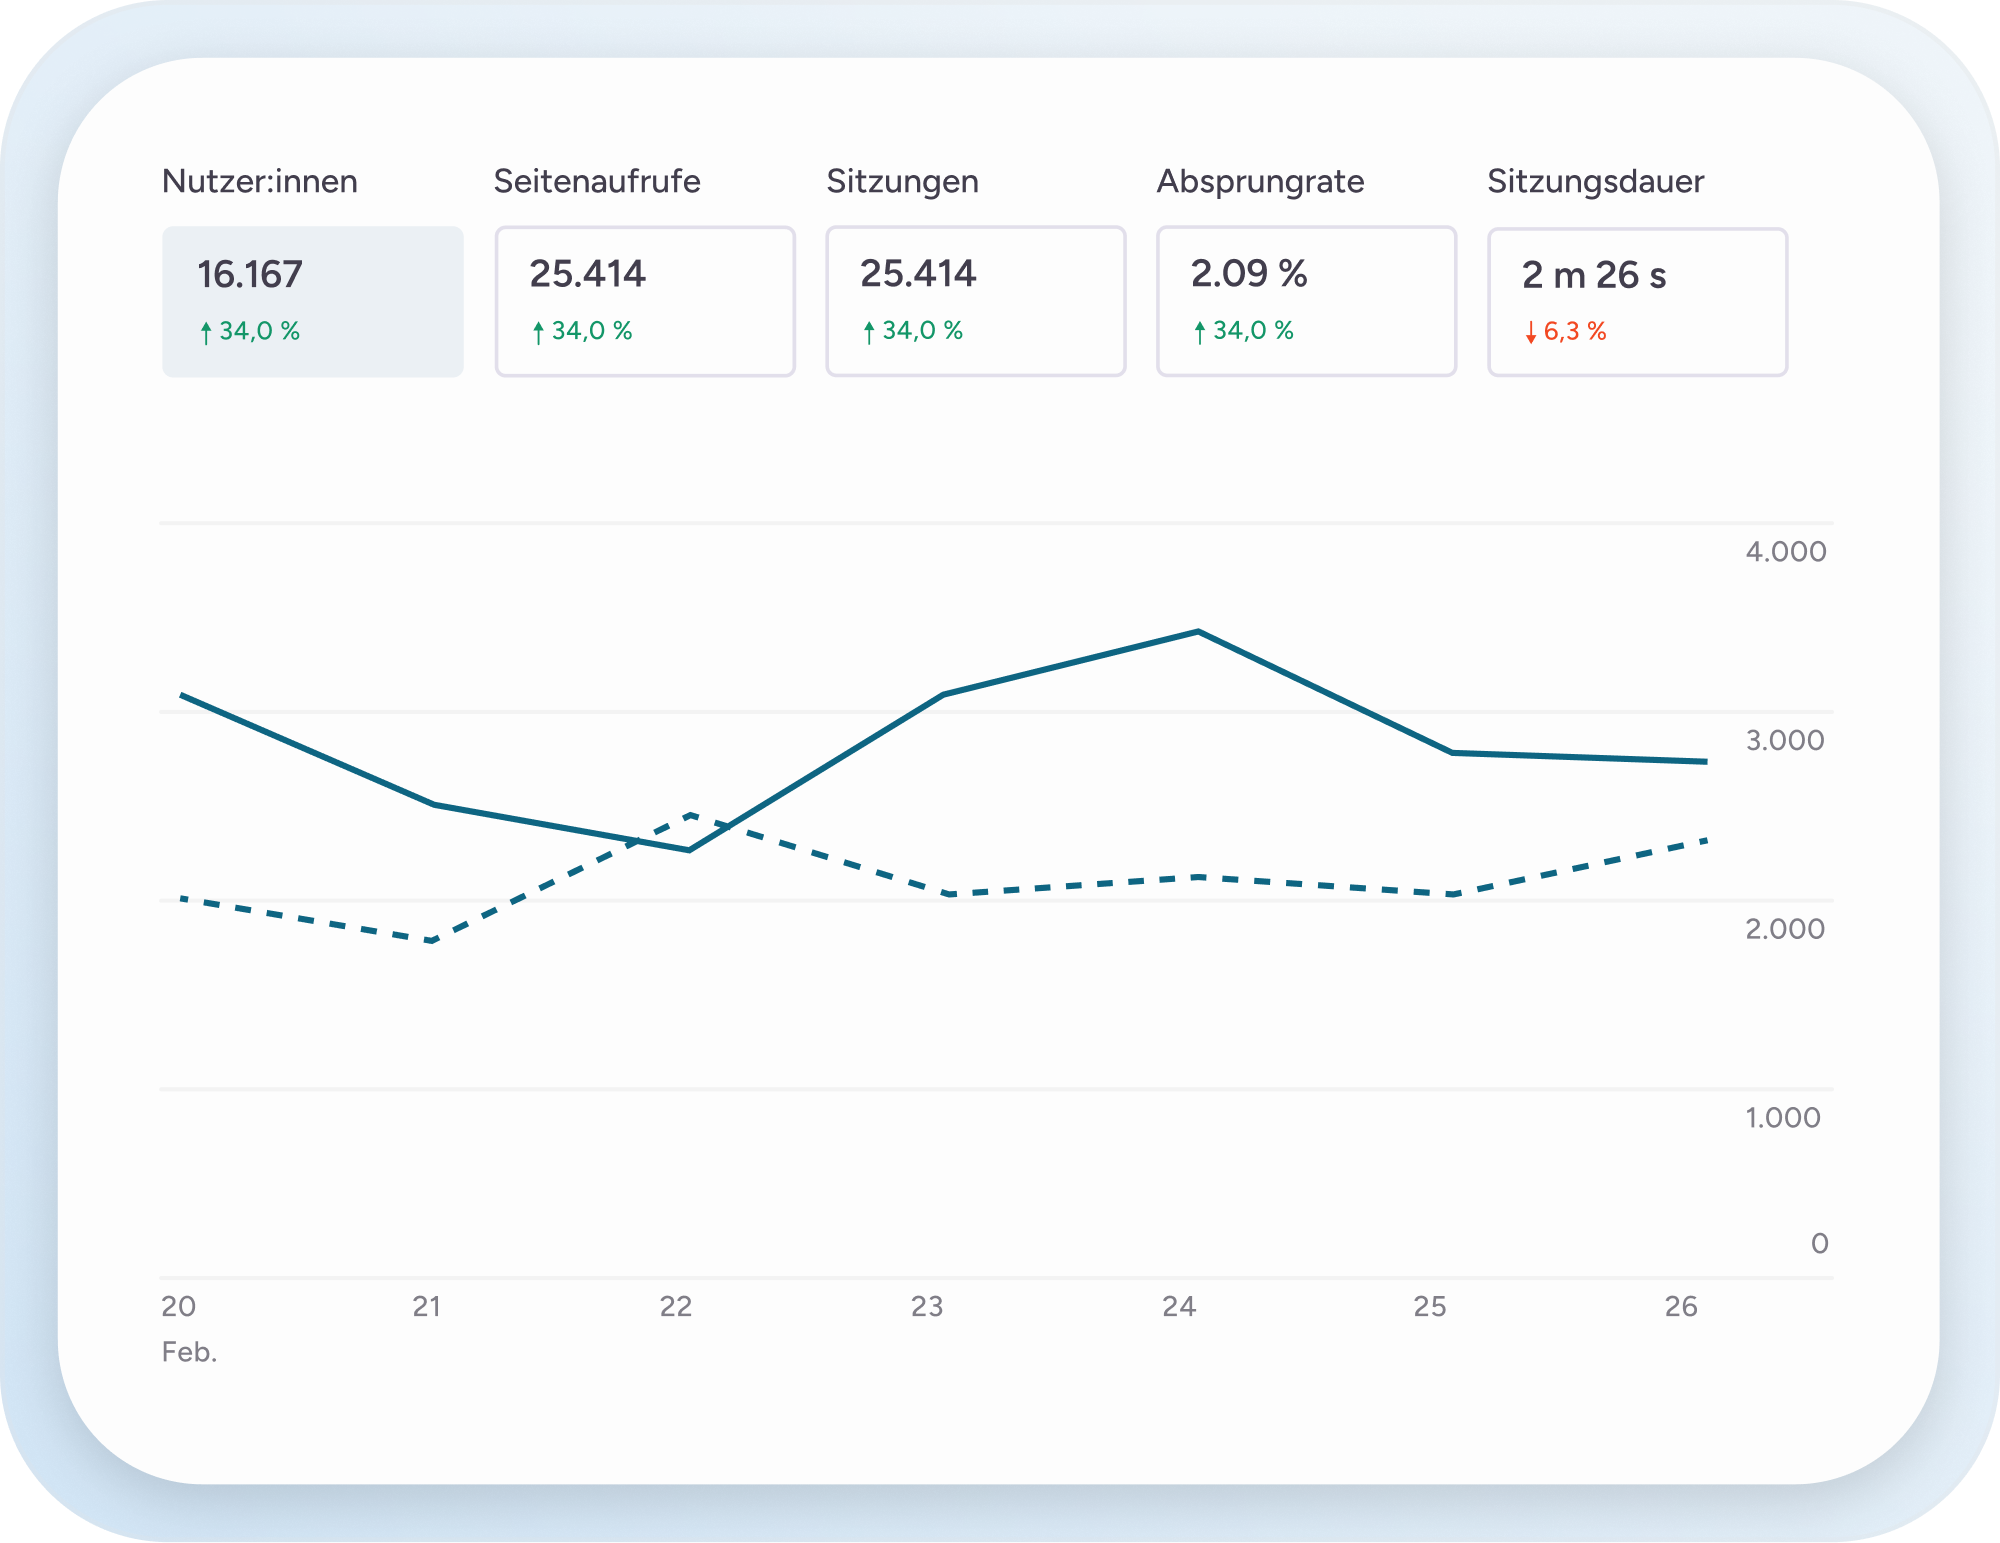
Compare performance data, spot trends, and understand which measures actually make an impact, data-driven and precise.
More about metricsBecause the platform fits seamlessly into your processes.
See where your visitors click and scroll directly on your website. No tab switching and no onboarding required.
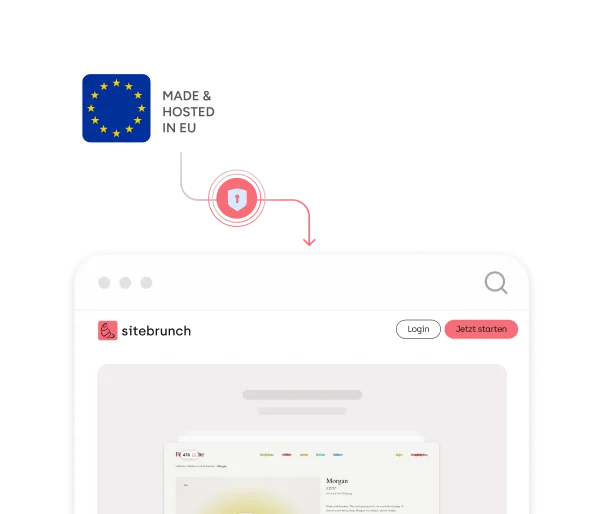
Privacy is not an add-on for us, it is the standard. We rely on European servers.
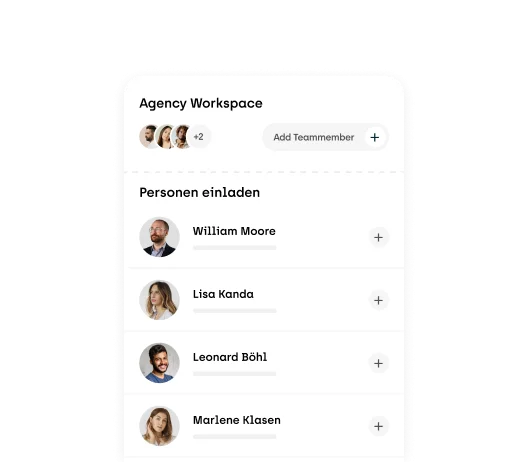
Connect all client domains at a fixed price and bring your whole team into the sitebrunch workspace.
Alongside fast support, a user-friendly solution matters hugely to us. sitebrunch's Accessibility Center has become a core part of our processes and we would not want to miss it. Highly recommended!
 Markus Wirtz
Managing Director
chris and friends GmbH
My highlight is the automated reports that keep me up to date on KPIs and changes at all times. The heatmaps are just as valuable for our shop: we can see instantly which elements work and where users drop off. With the comment feature, optimization opportunities can be shared with the team right away.
 Tim Buschulte
CEO
vinodo
Monitoring with sitebrunch completely convinced us: we can identify new barriers right away, and the heatmap helps us optimize the user flow in a targeted way. The collected data is presented clearly and concisely, all without data-heavy cookies. We are fans!
 Claudia Hartmann
Head of Communications & Events
Filmförderung Hamburg Schleswig-Holstein GmbH
Understand your users'' behavior and optimize your website in a targeted way. Starting at 49 EUR per month.
Get started (öffnet neuen Tab)