Measure performance and understand what works
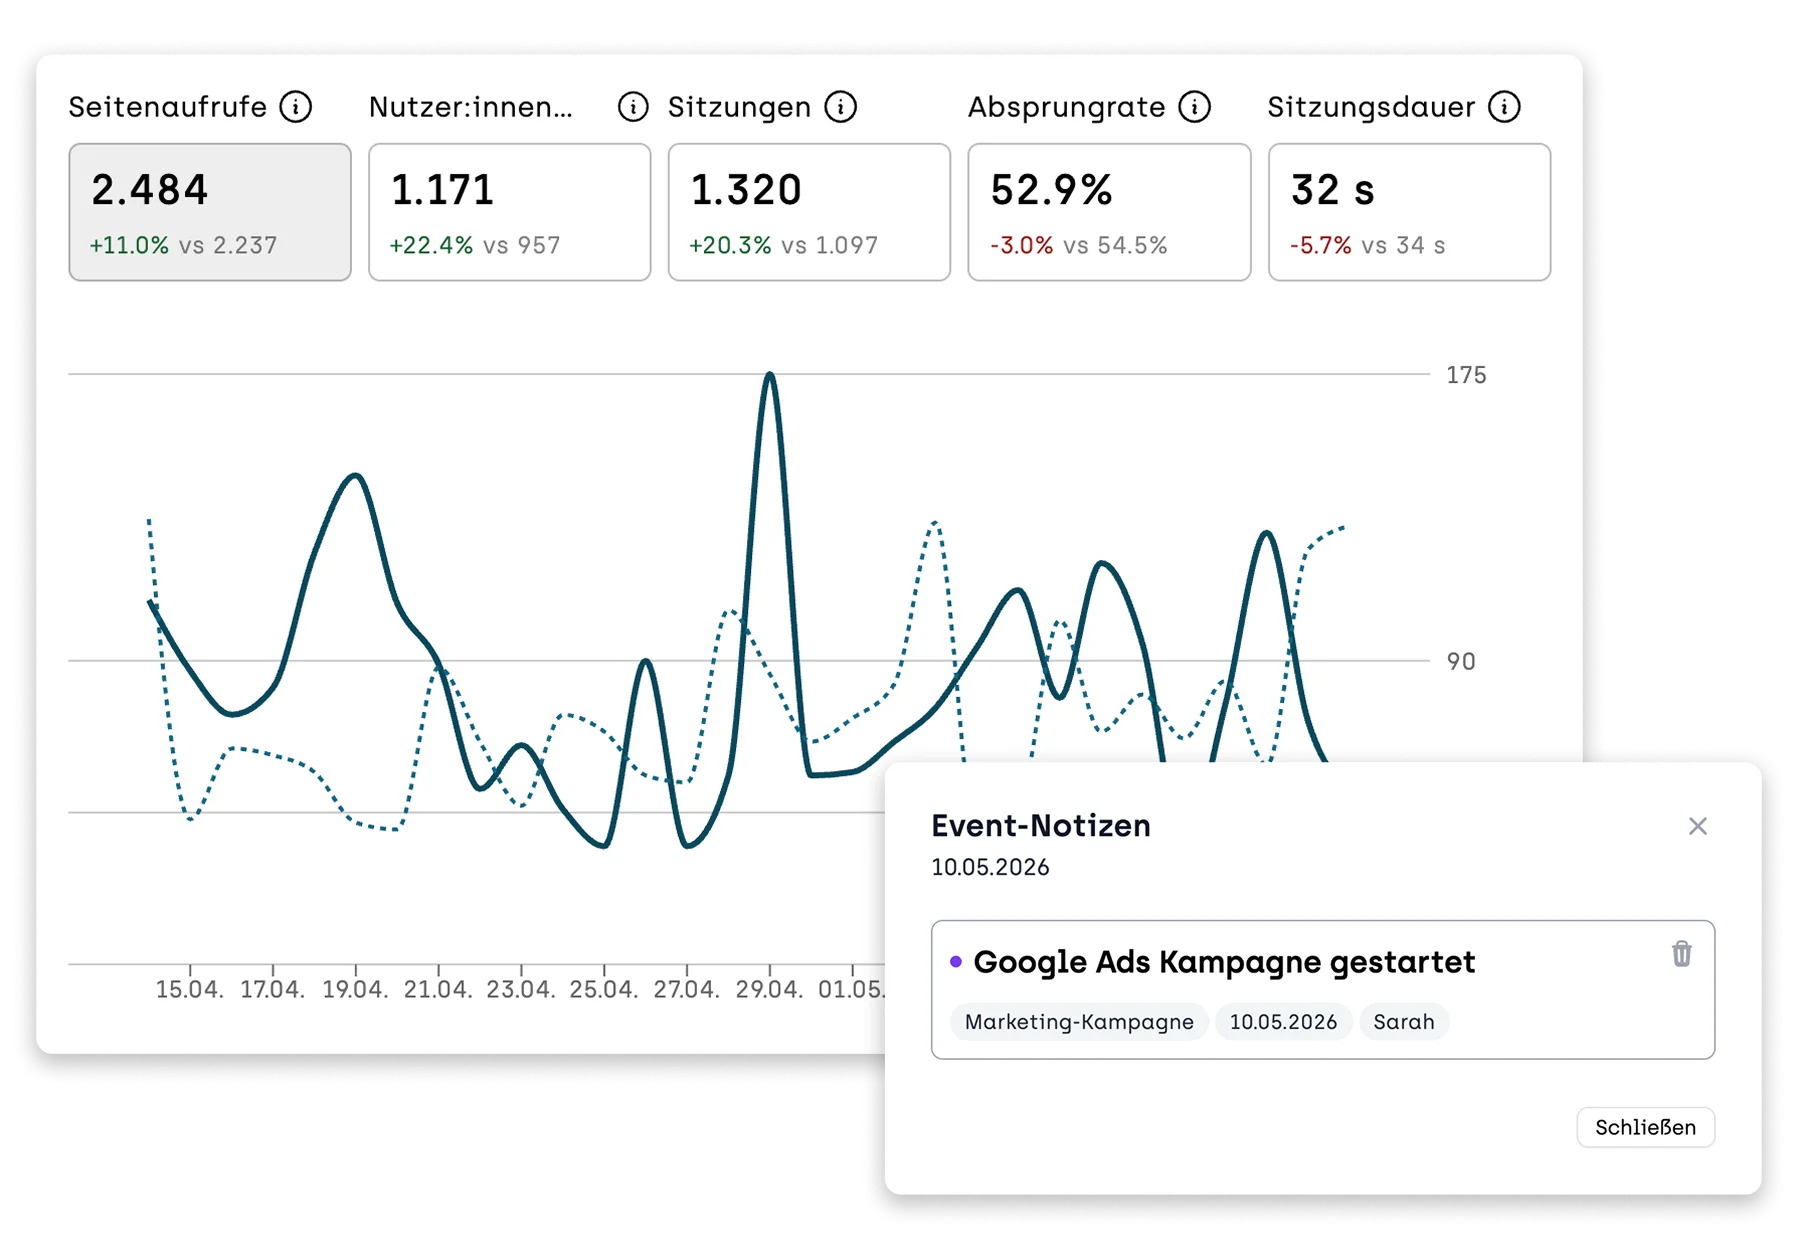
MetricsCompare time periods and pages side by side, and add notes for when a change went live. That way you not only see what the data shows, but also why something changed.
Forget gut feelings and endless spreadsheets. Understand how users experience your website and optimize your content with purpose.
Compare time periods and pages side by side, and add notes for when a change went live. That way you not only see what the data shows, but also why something changed.
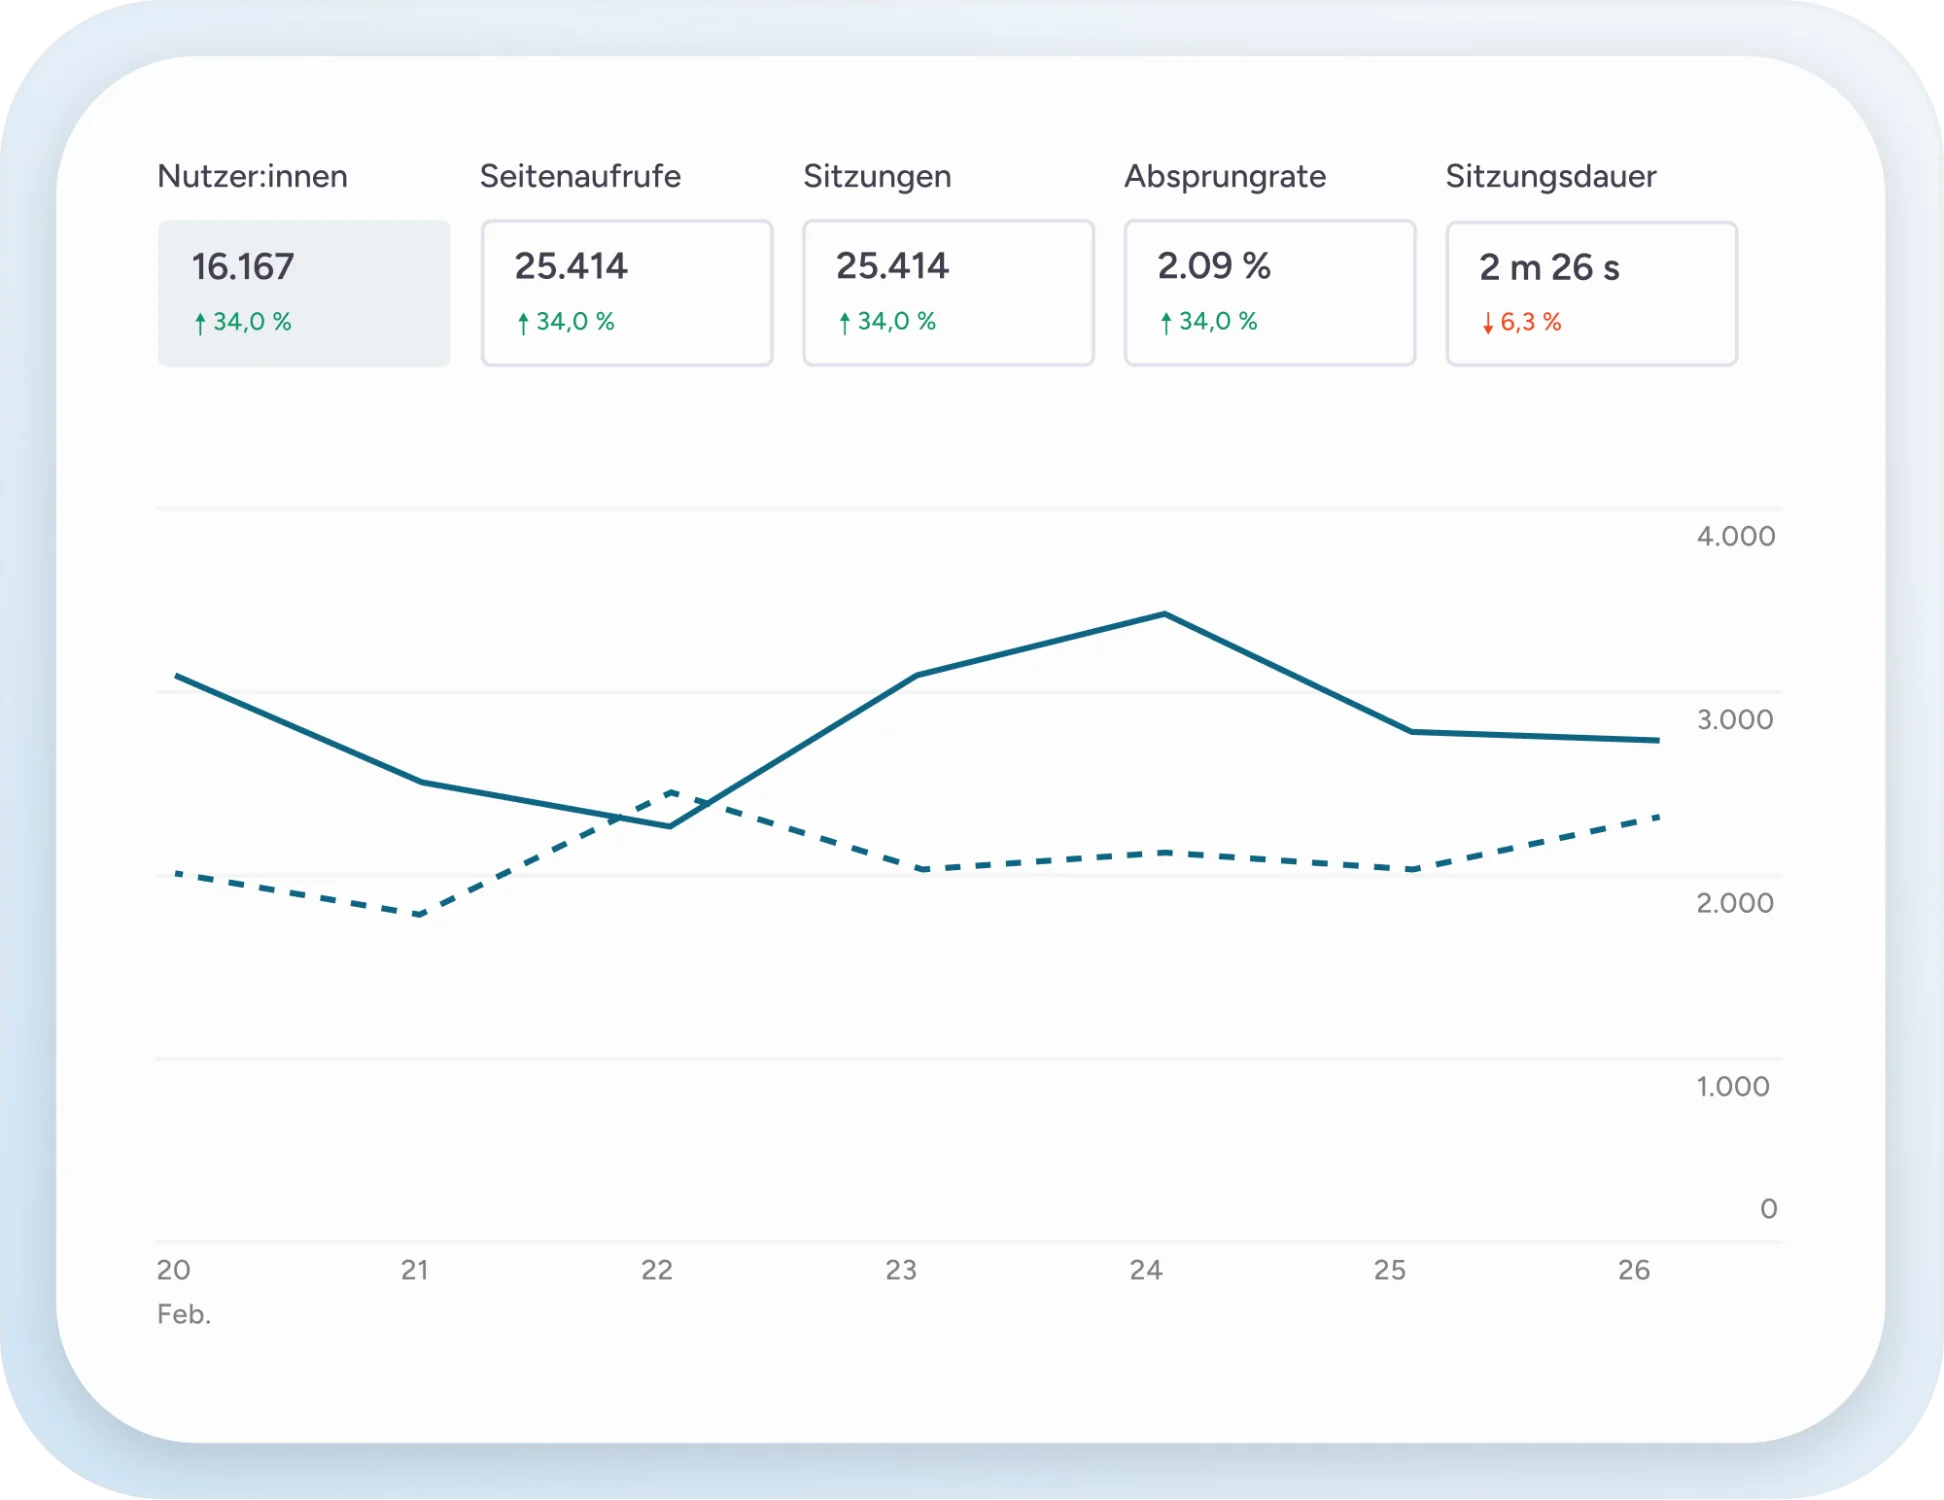
Page views, bounce rate, device usage, and more. Every KPI in one clear dashboard.
Capture when each change went live and measure its effect.
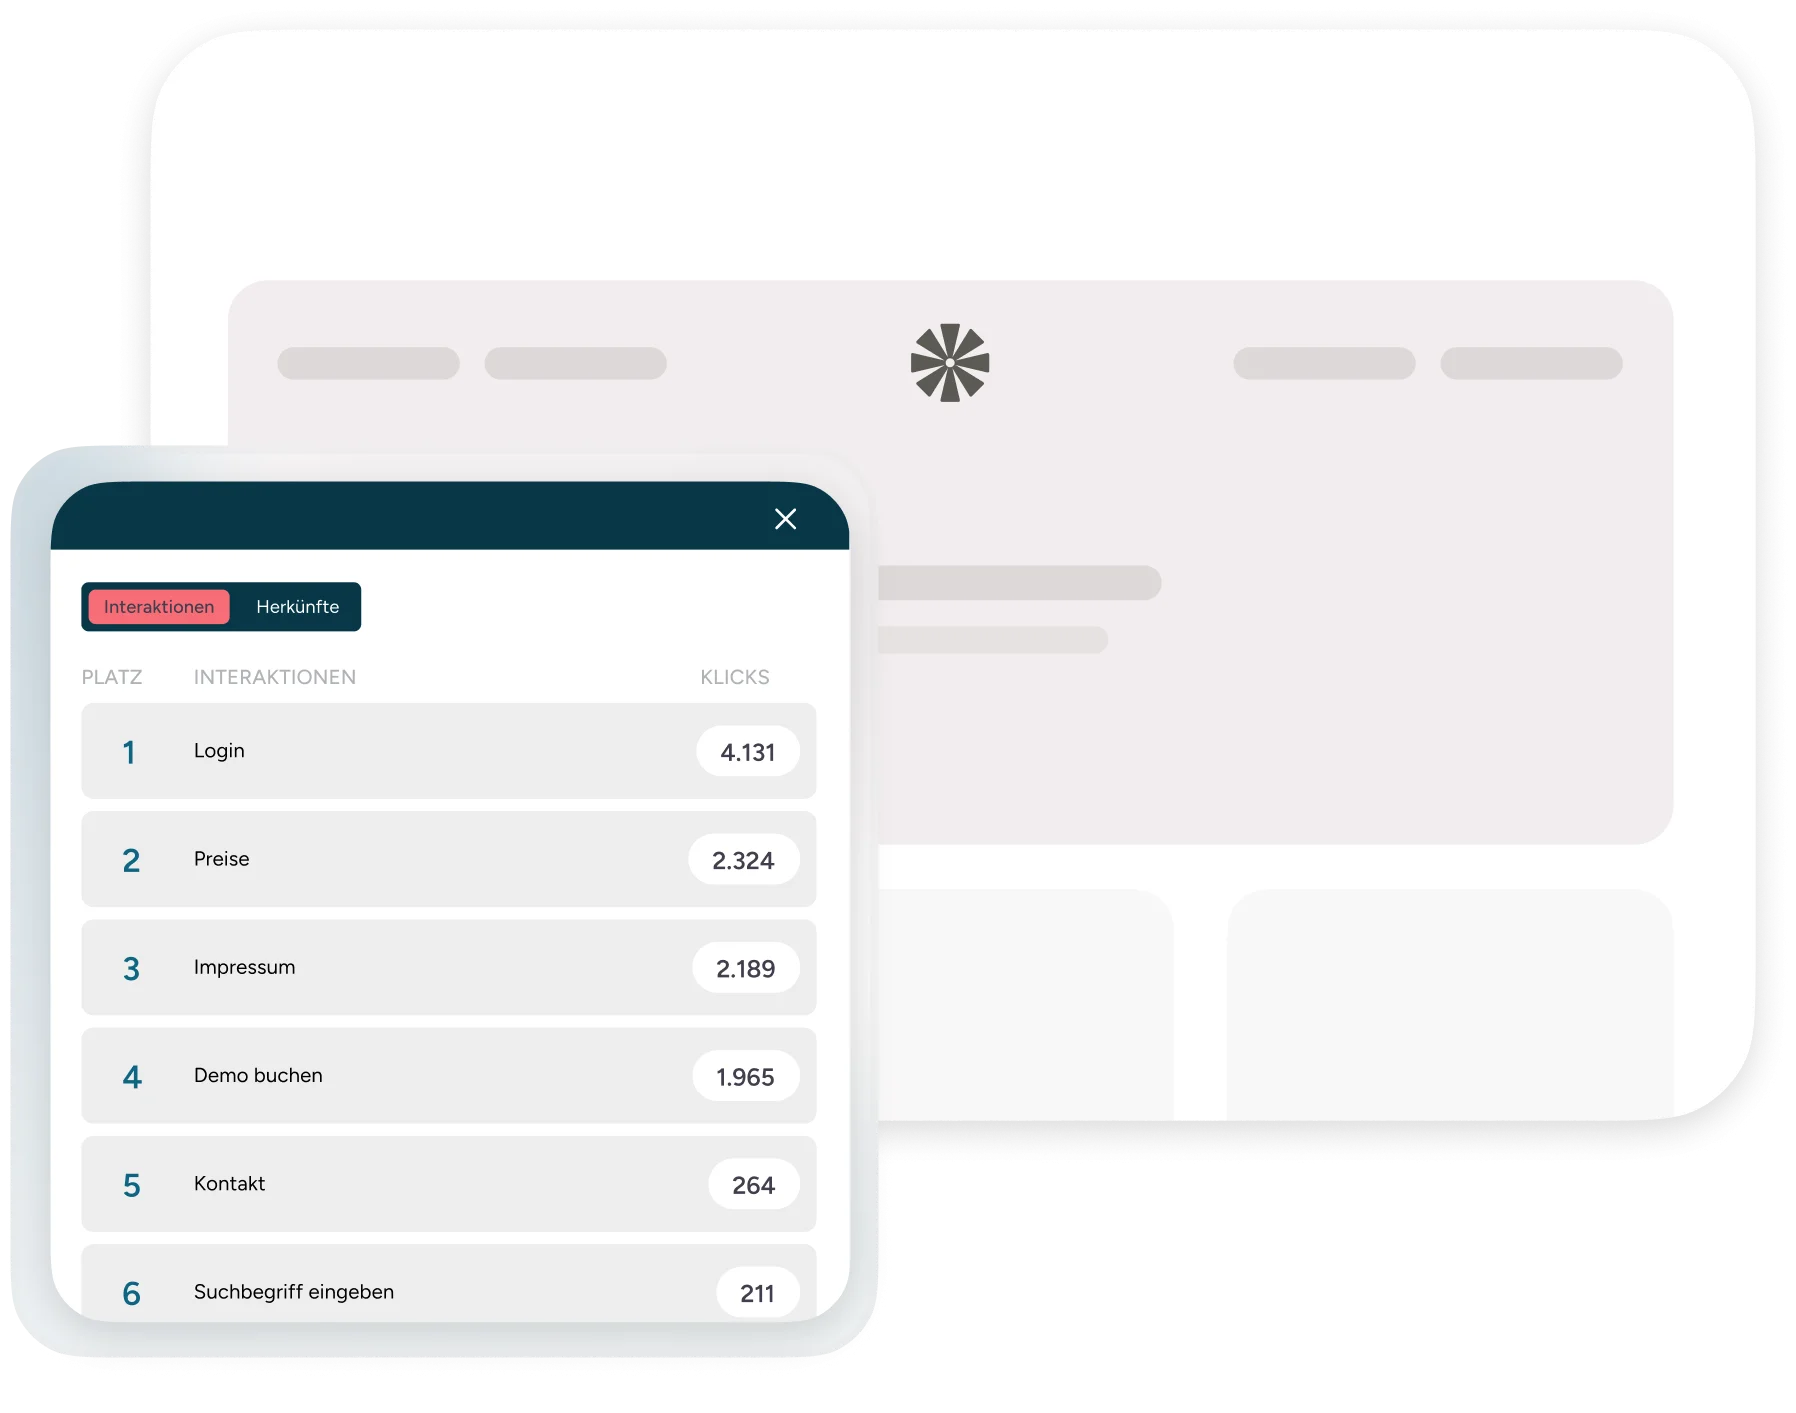
See your metrics directly on your website with the sitebrunch Onsite View.
Export data as .csv or .pptx for teams and colleagues.
No cookie banner and hosting in the EU. Analytics without compromise.
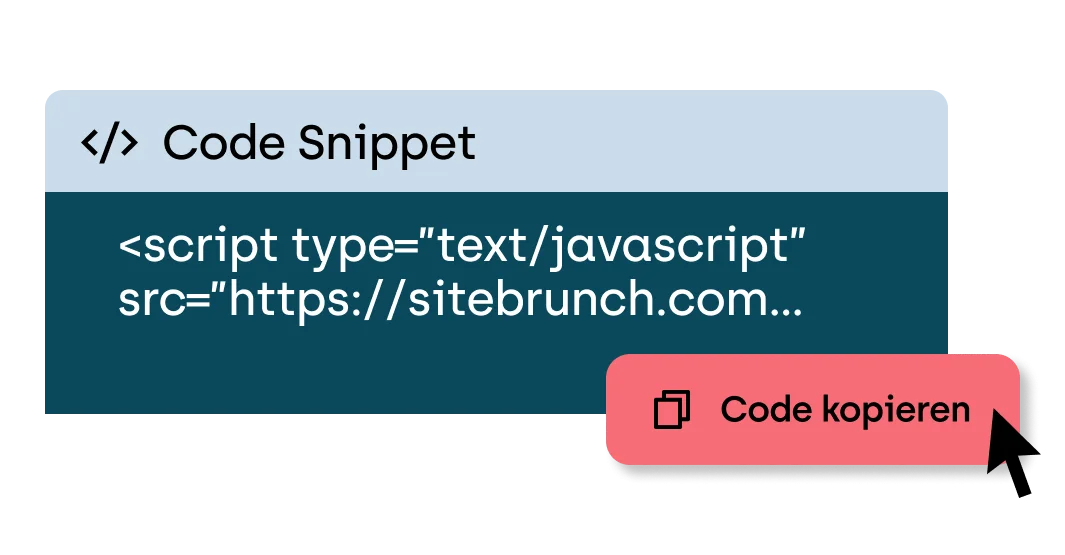
We provide a code snippet that you simply embed in your website's HTML head to unlock every sitebrunch feature. It has no impact on load time and starts collecting data immediately.
The central dashboard shows every KPI at a glance. Use filters and tab navigation to find exactly the data you need.
With the Onsite View, you see metrics as an overlay right on your website. That way the numbers stay in the context of the actual page.
Export data as .csv or .pptx and share the results with stakeholders, clients, or your team.

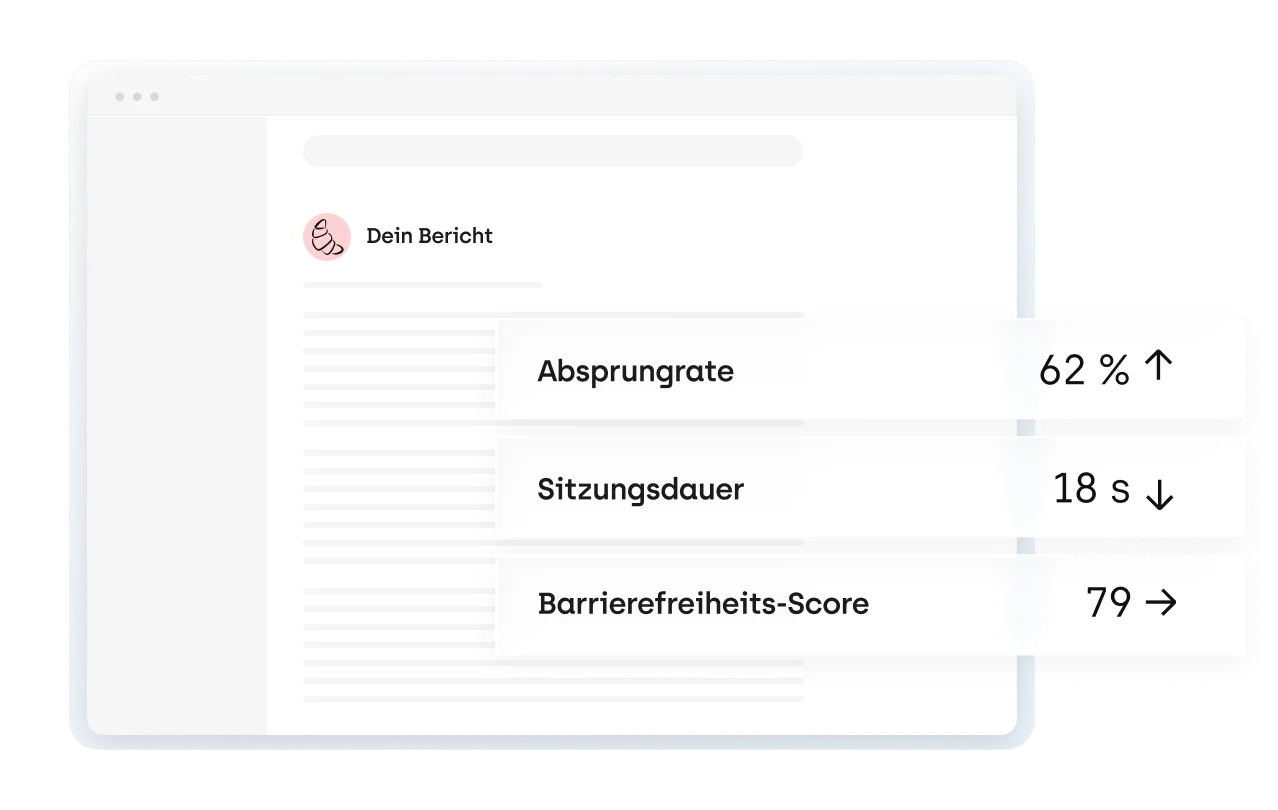
Keep an eye on your website's user experience without checking the dashboard every day. The report shows you what has changed and where action is needed, delivered straight to your inbox.
Get started with sitebrunch Metrics and understand how your website really performs.
Try it now (öffnet neuen Tab)