This article shows you what you see at a glance in Metrics and how to change the time period.
Last updated: October 2, 2026
Requirements
The snippet is installed on your website.
Your workspace has at least the Starter plan.
Open Metrics
In the menu under “User Experience”, click “Metrics”. The “Complete site” tab shows you the numbers for your whole website.
The five tiles
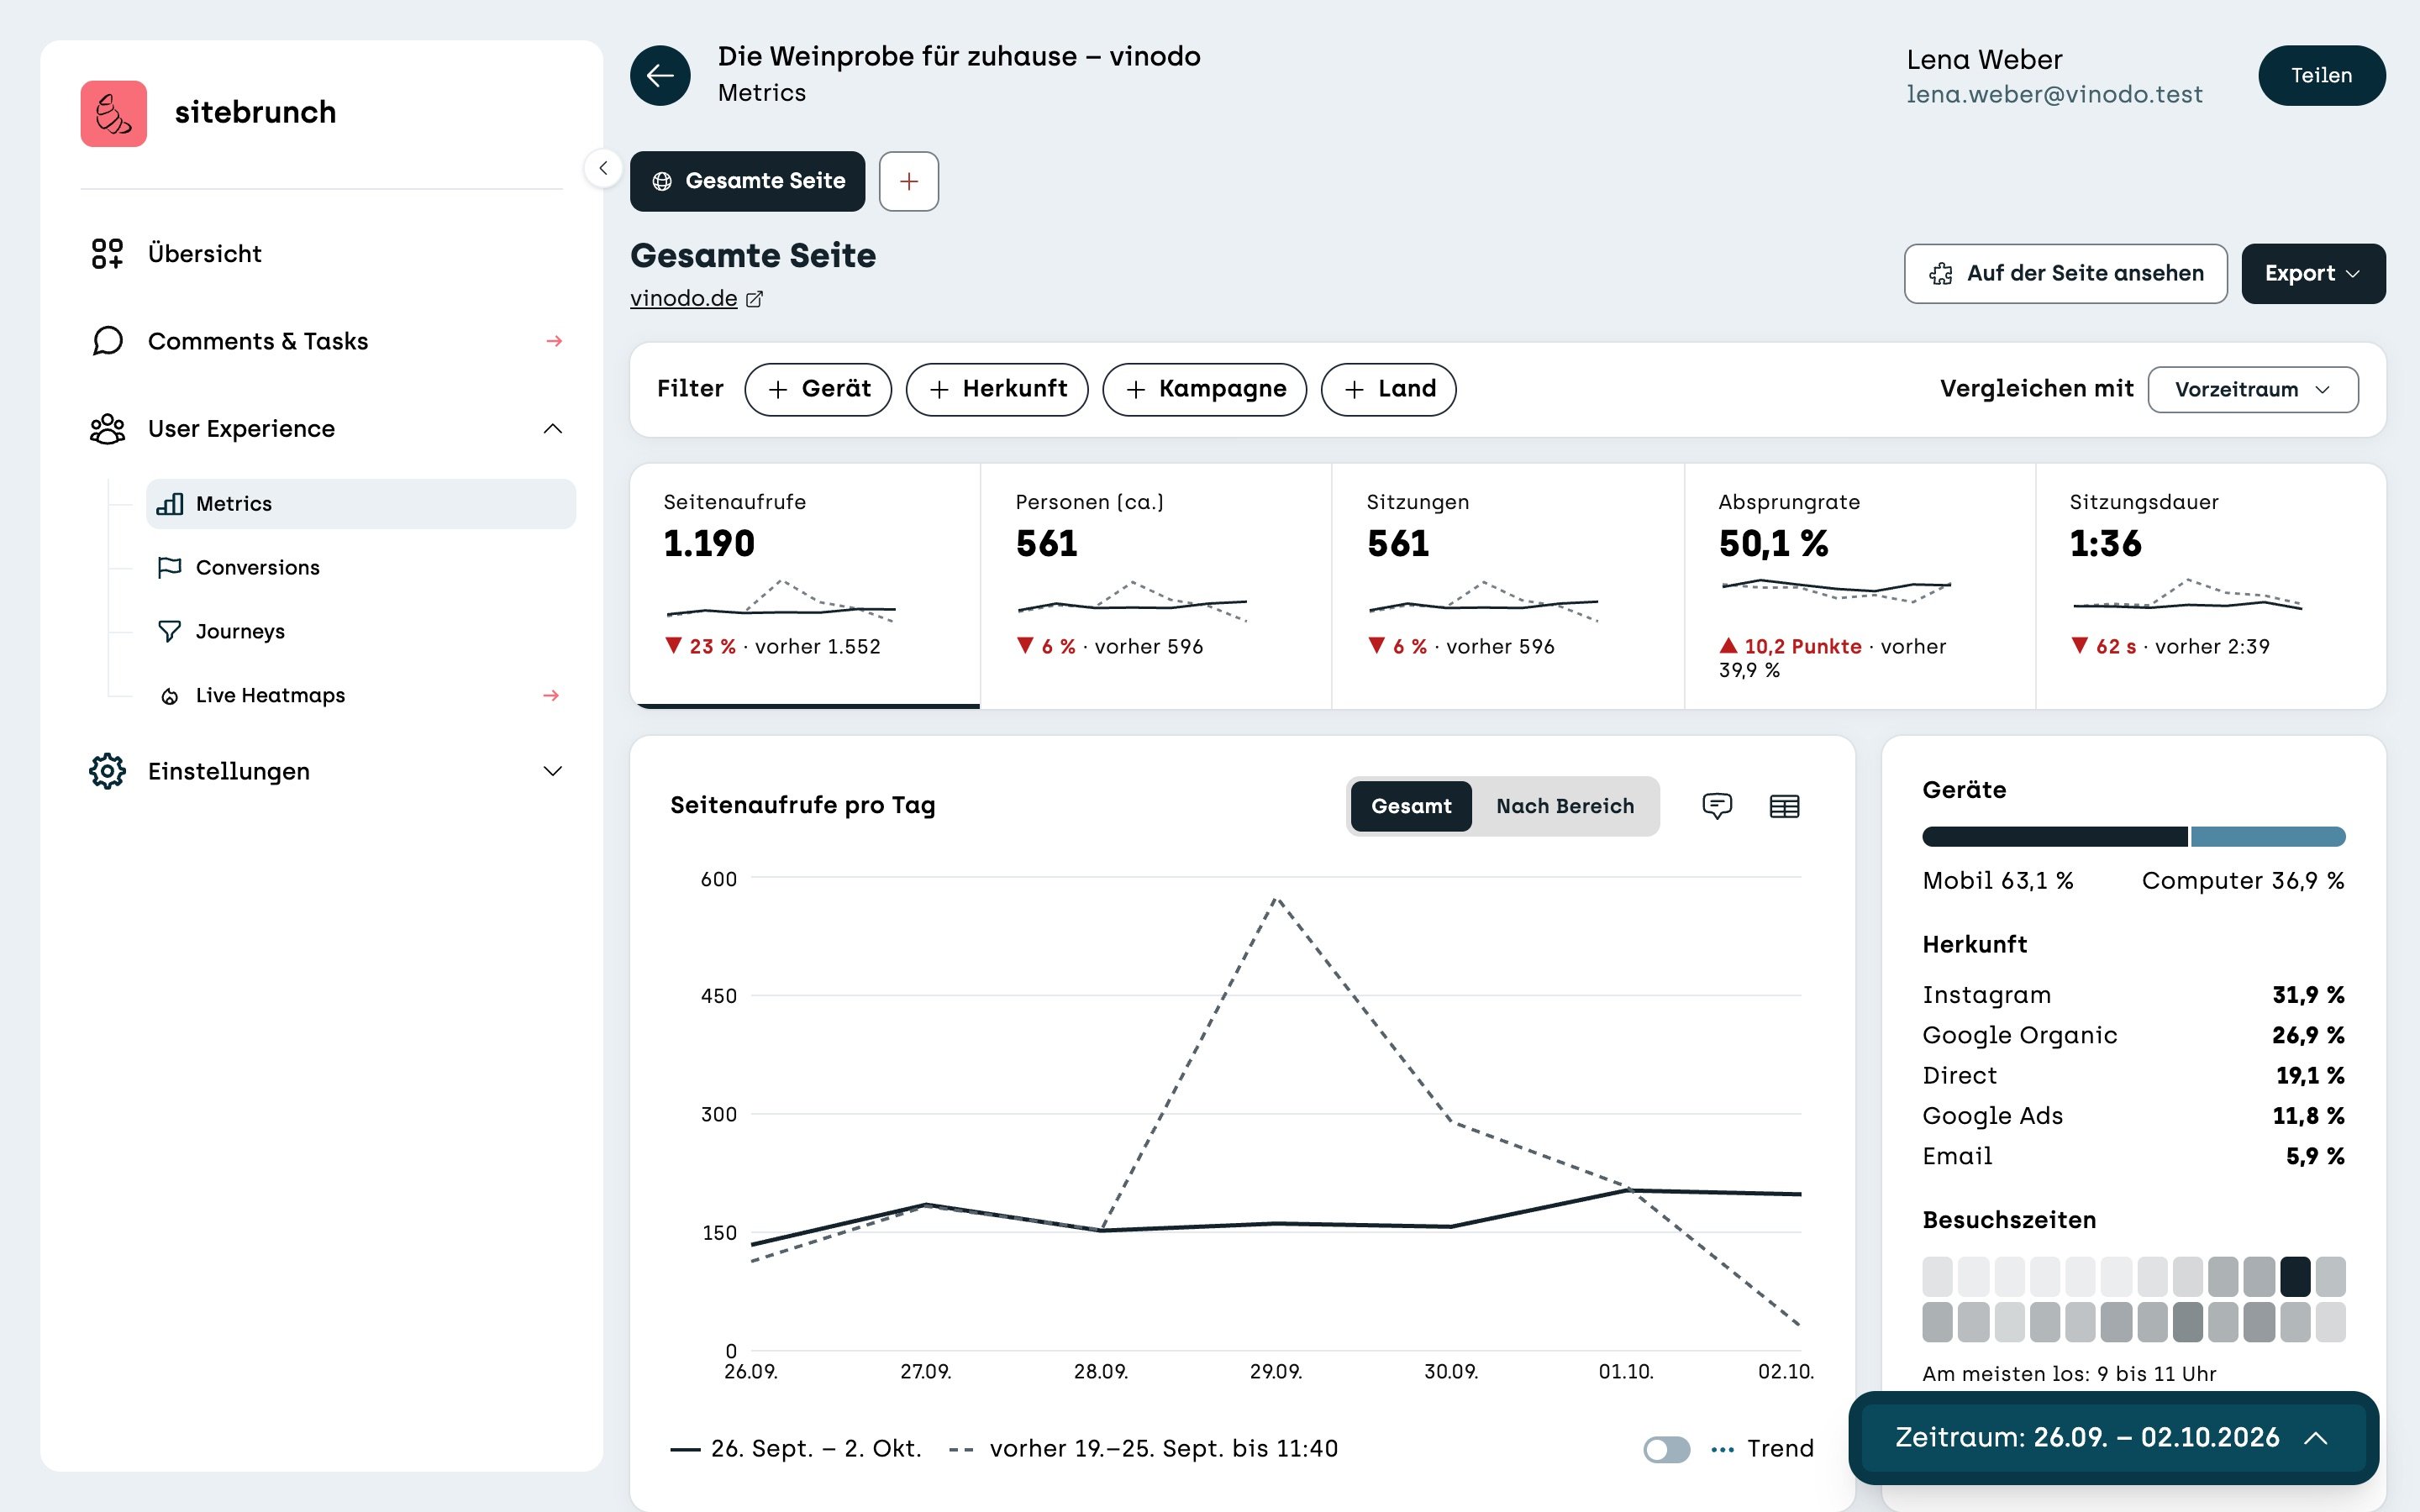
At the top there are five numbers: “Page views”, “People (approx.)”, “Sessions”, “Bounce rate” and “Session duration”. Under each number you see how it has changed compared with the comparison period, and the previous value.
The people figure is an approximate value because sitebrunch counts without cookies.
Click a tile to see it in the large chart below. For example, a click on “Bounce rate” shows you the bounce rate per day.
The chart
The solid line is the time period you chose, the dashed line is the comparison period. That way you see right away on which day something was different.
With the two icons at the top right you add a note, for example “Newsletter sent”, or show the data as a table.
Devices, sources and visit times
To the right of the chart you see how many people come on a phone and how many on a computer, which sources they come from, and at which times of day it's busiest.
Change the time period
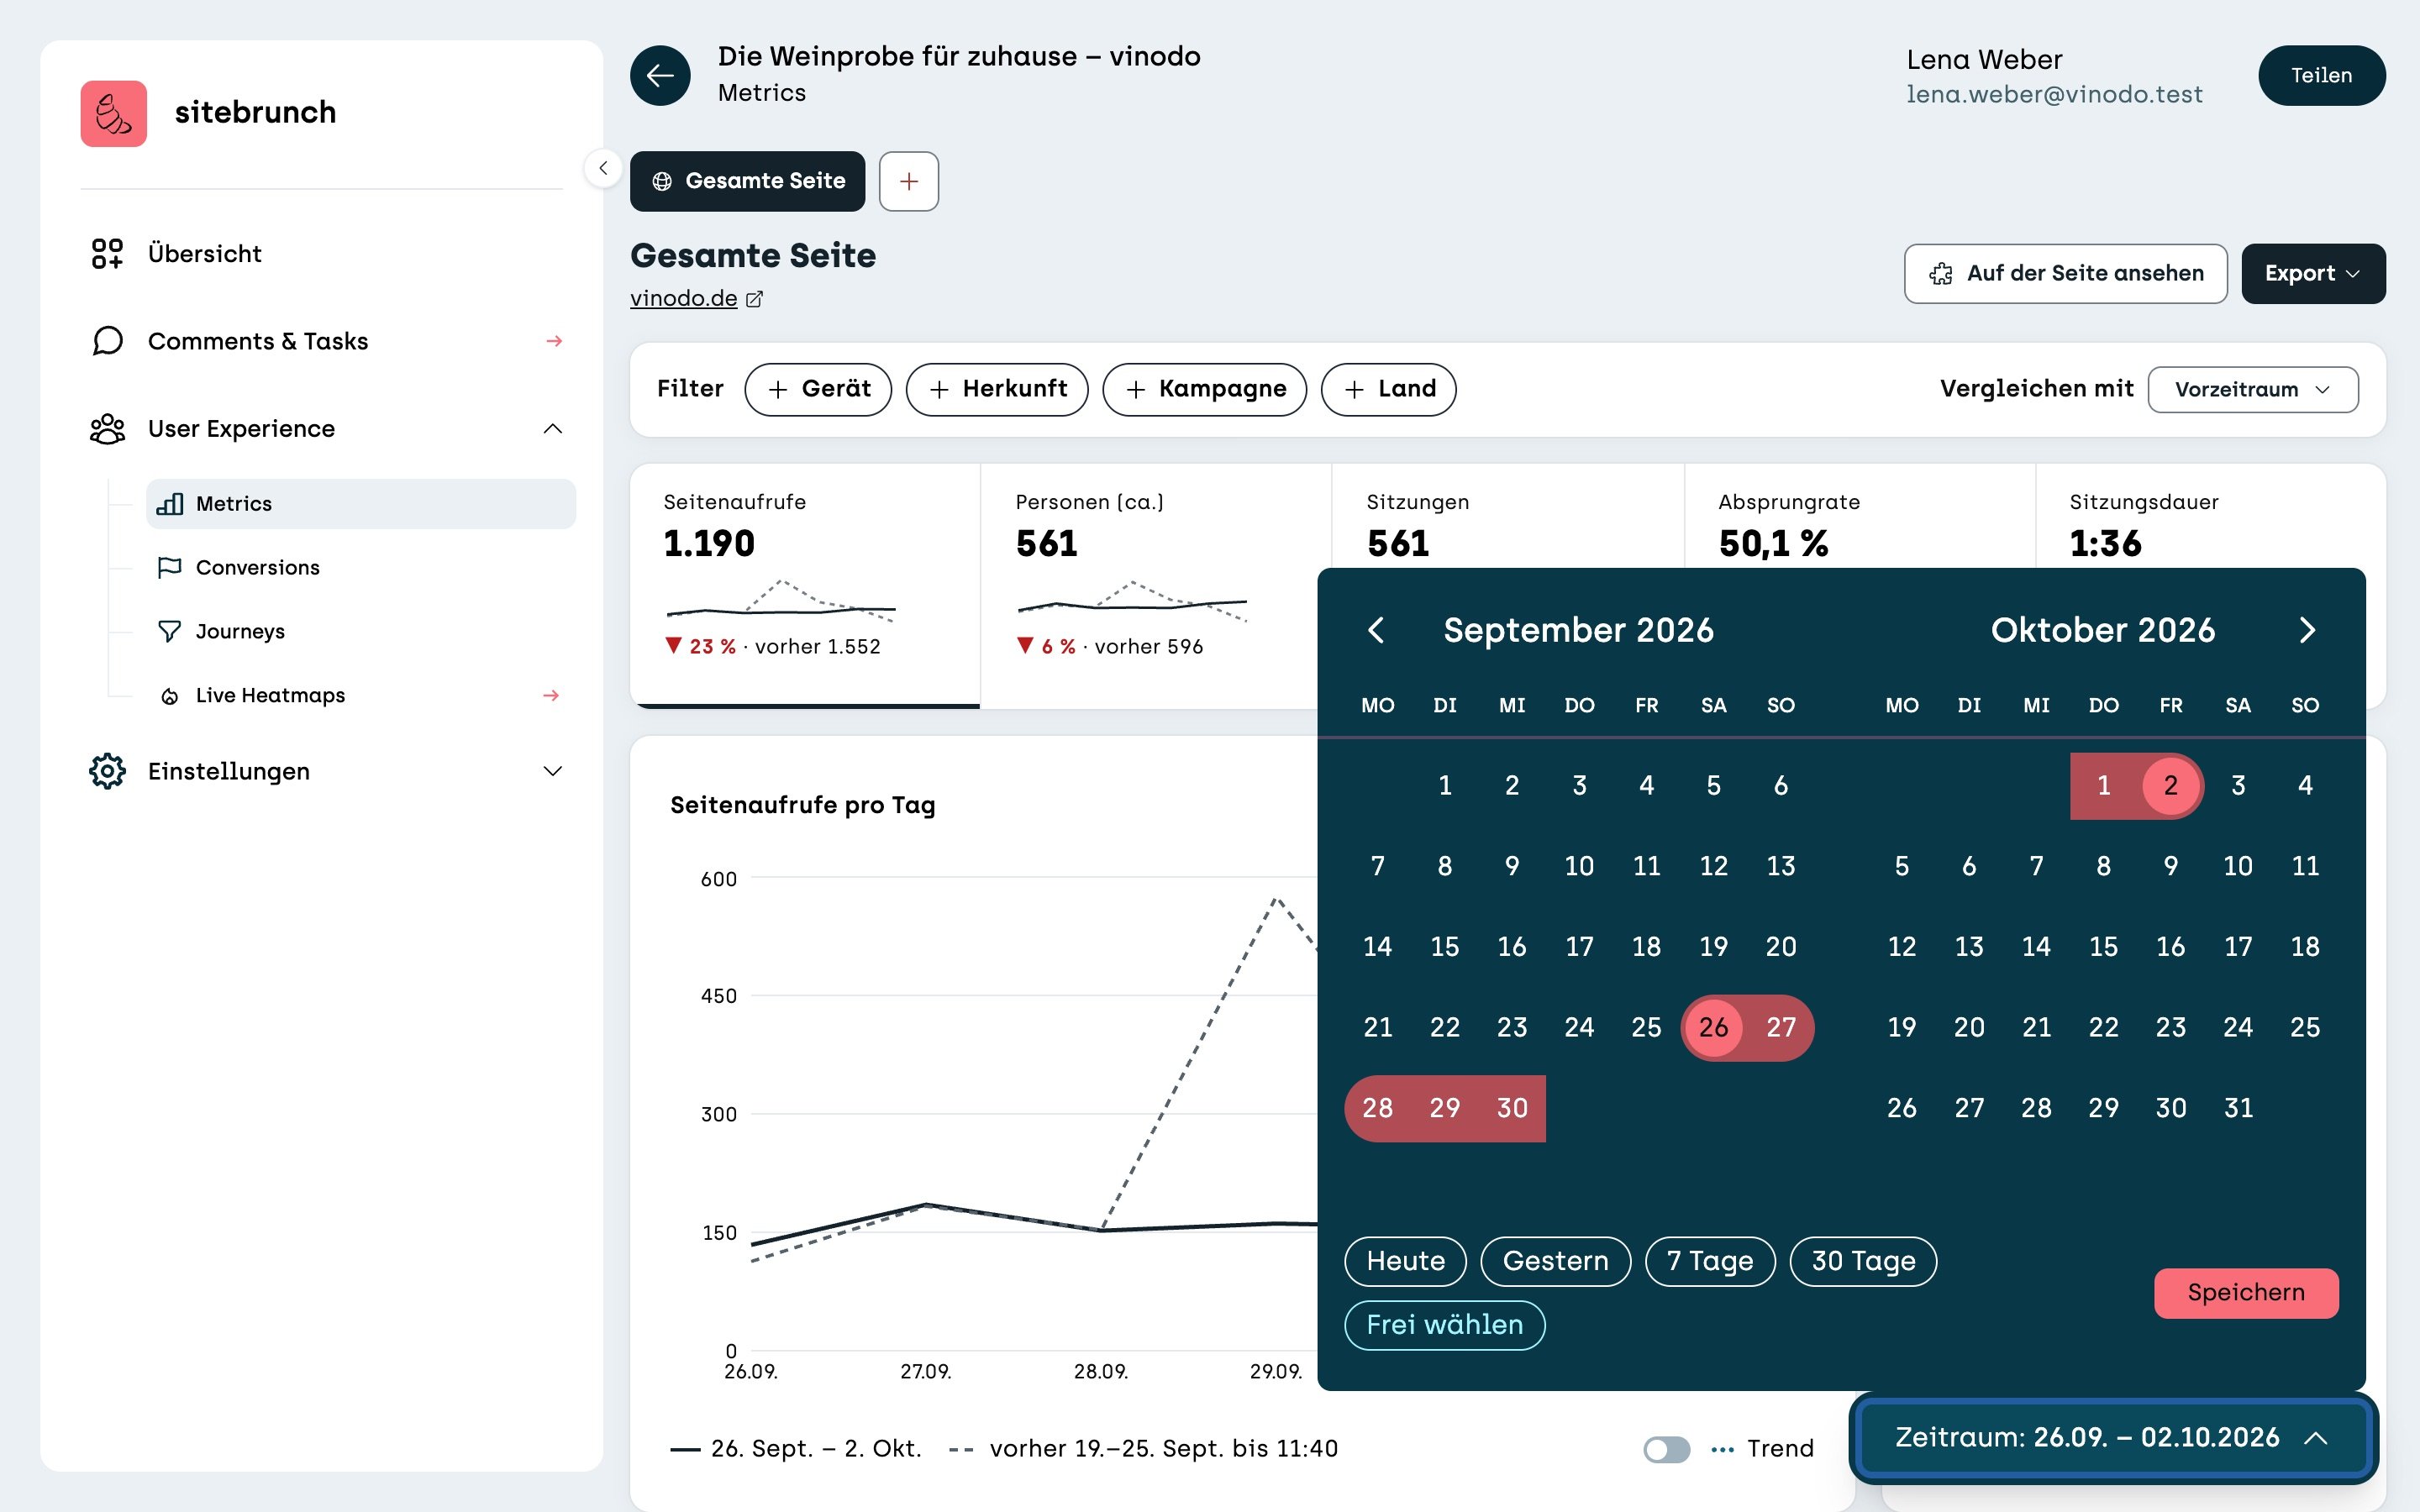
The current time period is always shown at the bottom right. Click it to open the calendar. Choose a start day and an end day, or use a quick pick like “7 days” or “30 days”. Then click “Save”.