
With filters you see the numbers only for certain visits, for example only from Instagram. This article shows you how that works and what you can compare with.
Last updated: October 2, 2026
Requirements
You know the Metrics overview.
Set a filter
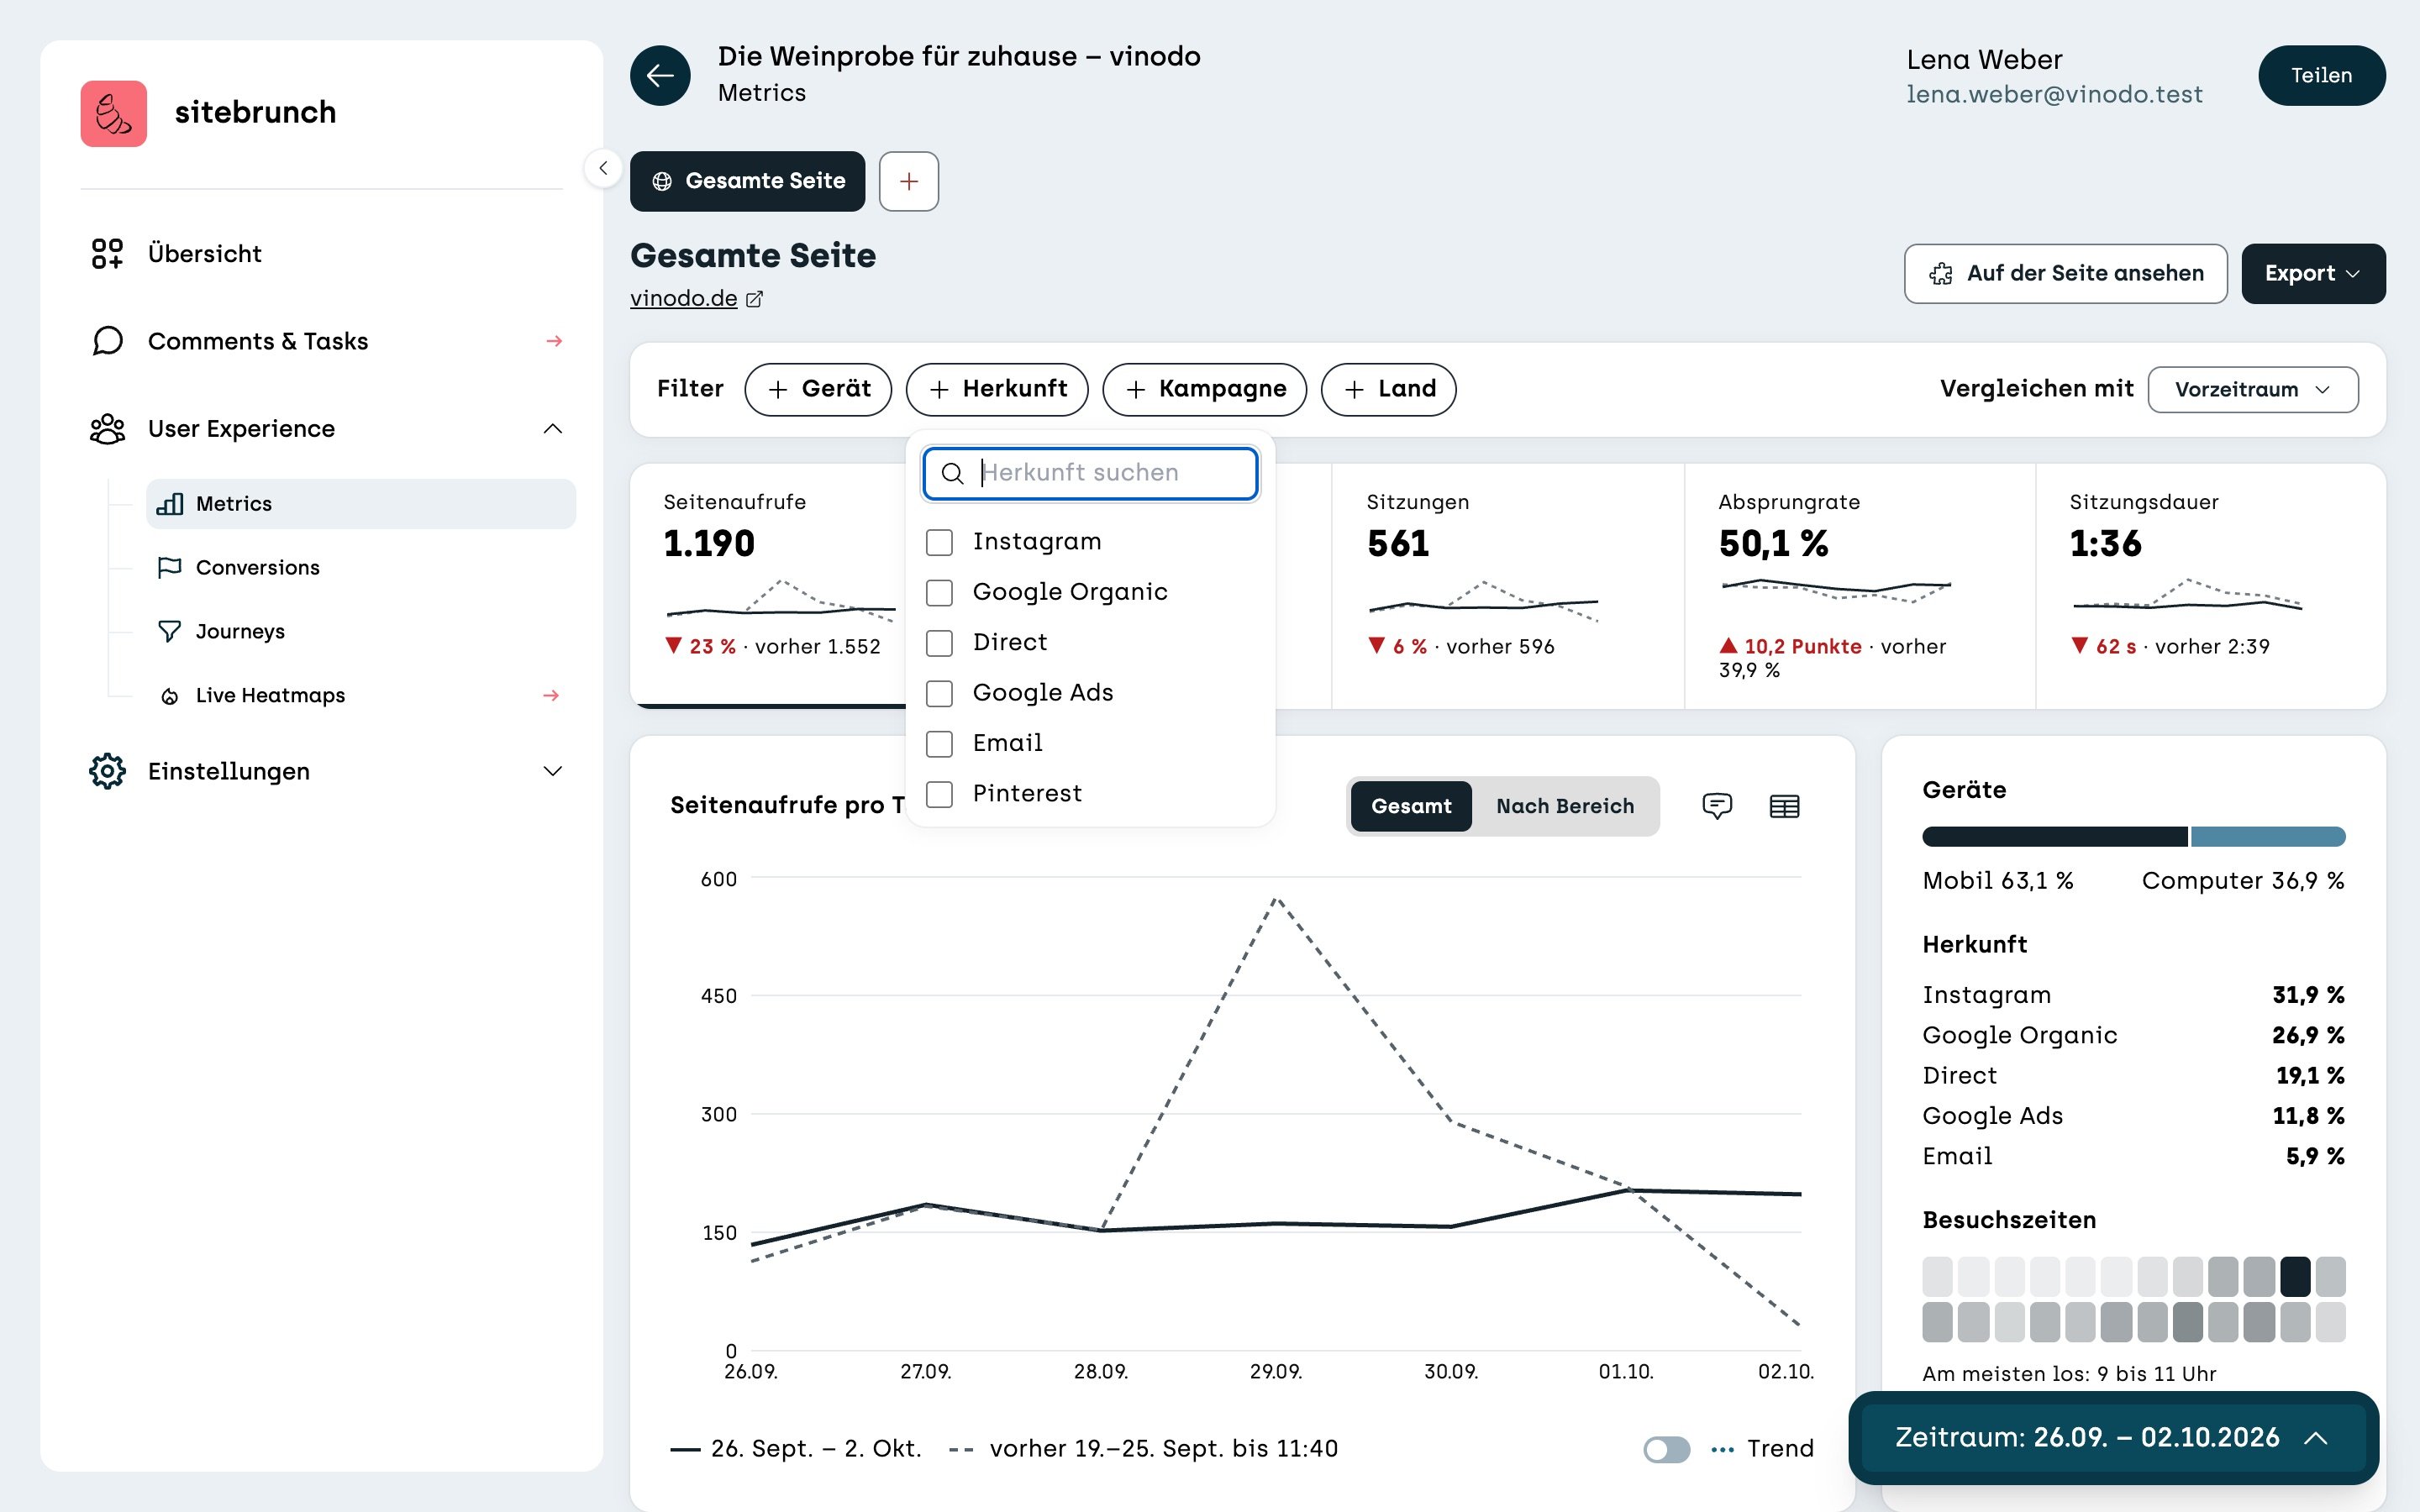
Above the tiles you'll find four filters: “Device”, “Source”, “Campaign” and “Country”. For example, click “Source”. A list opens with all the sources of your visits. Tick one or more.
Now all tiles and charts only show visits from that source. For vinodo.de you quickly see: visits from Instagram come almost only on phones, stay 11 seconds on average and mostly leave after one page.
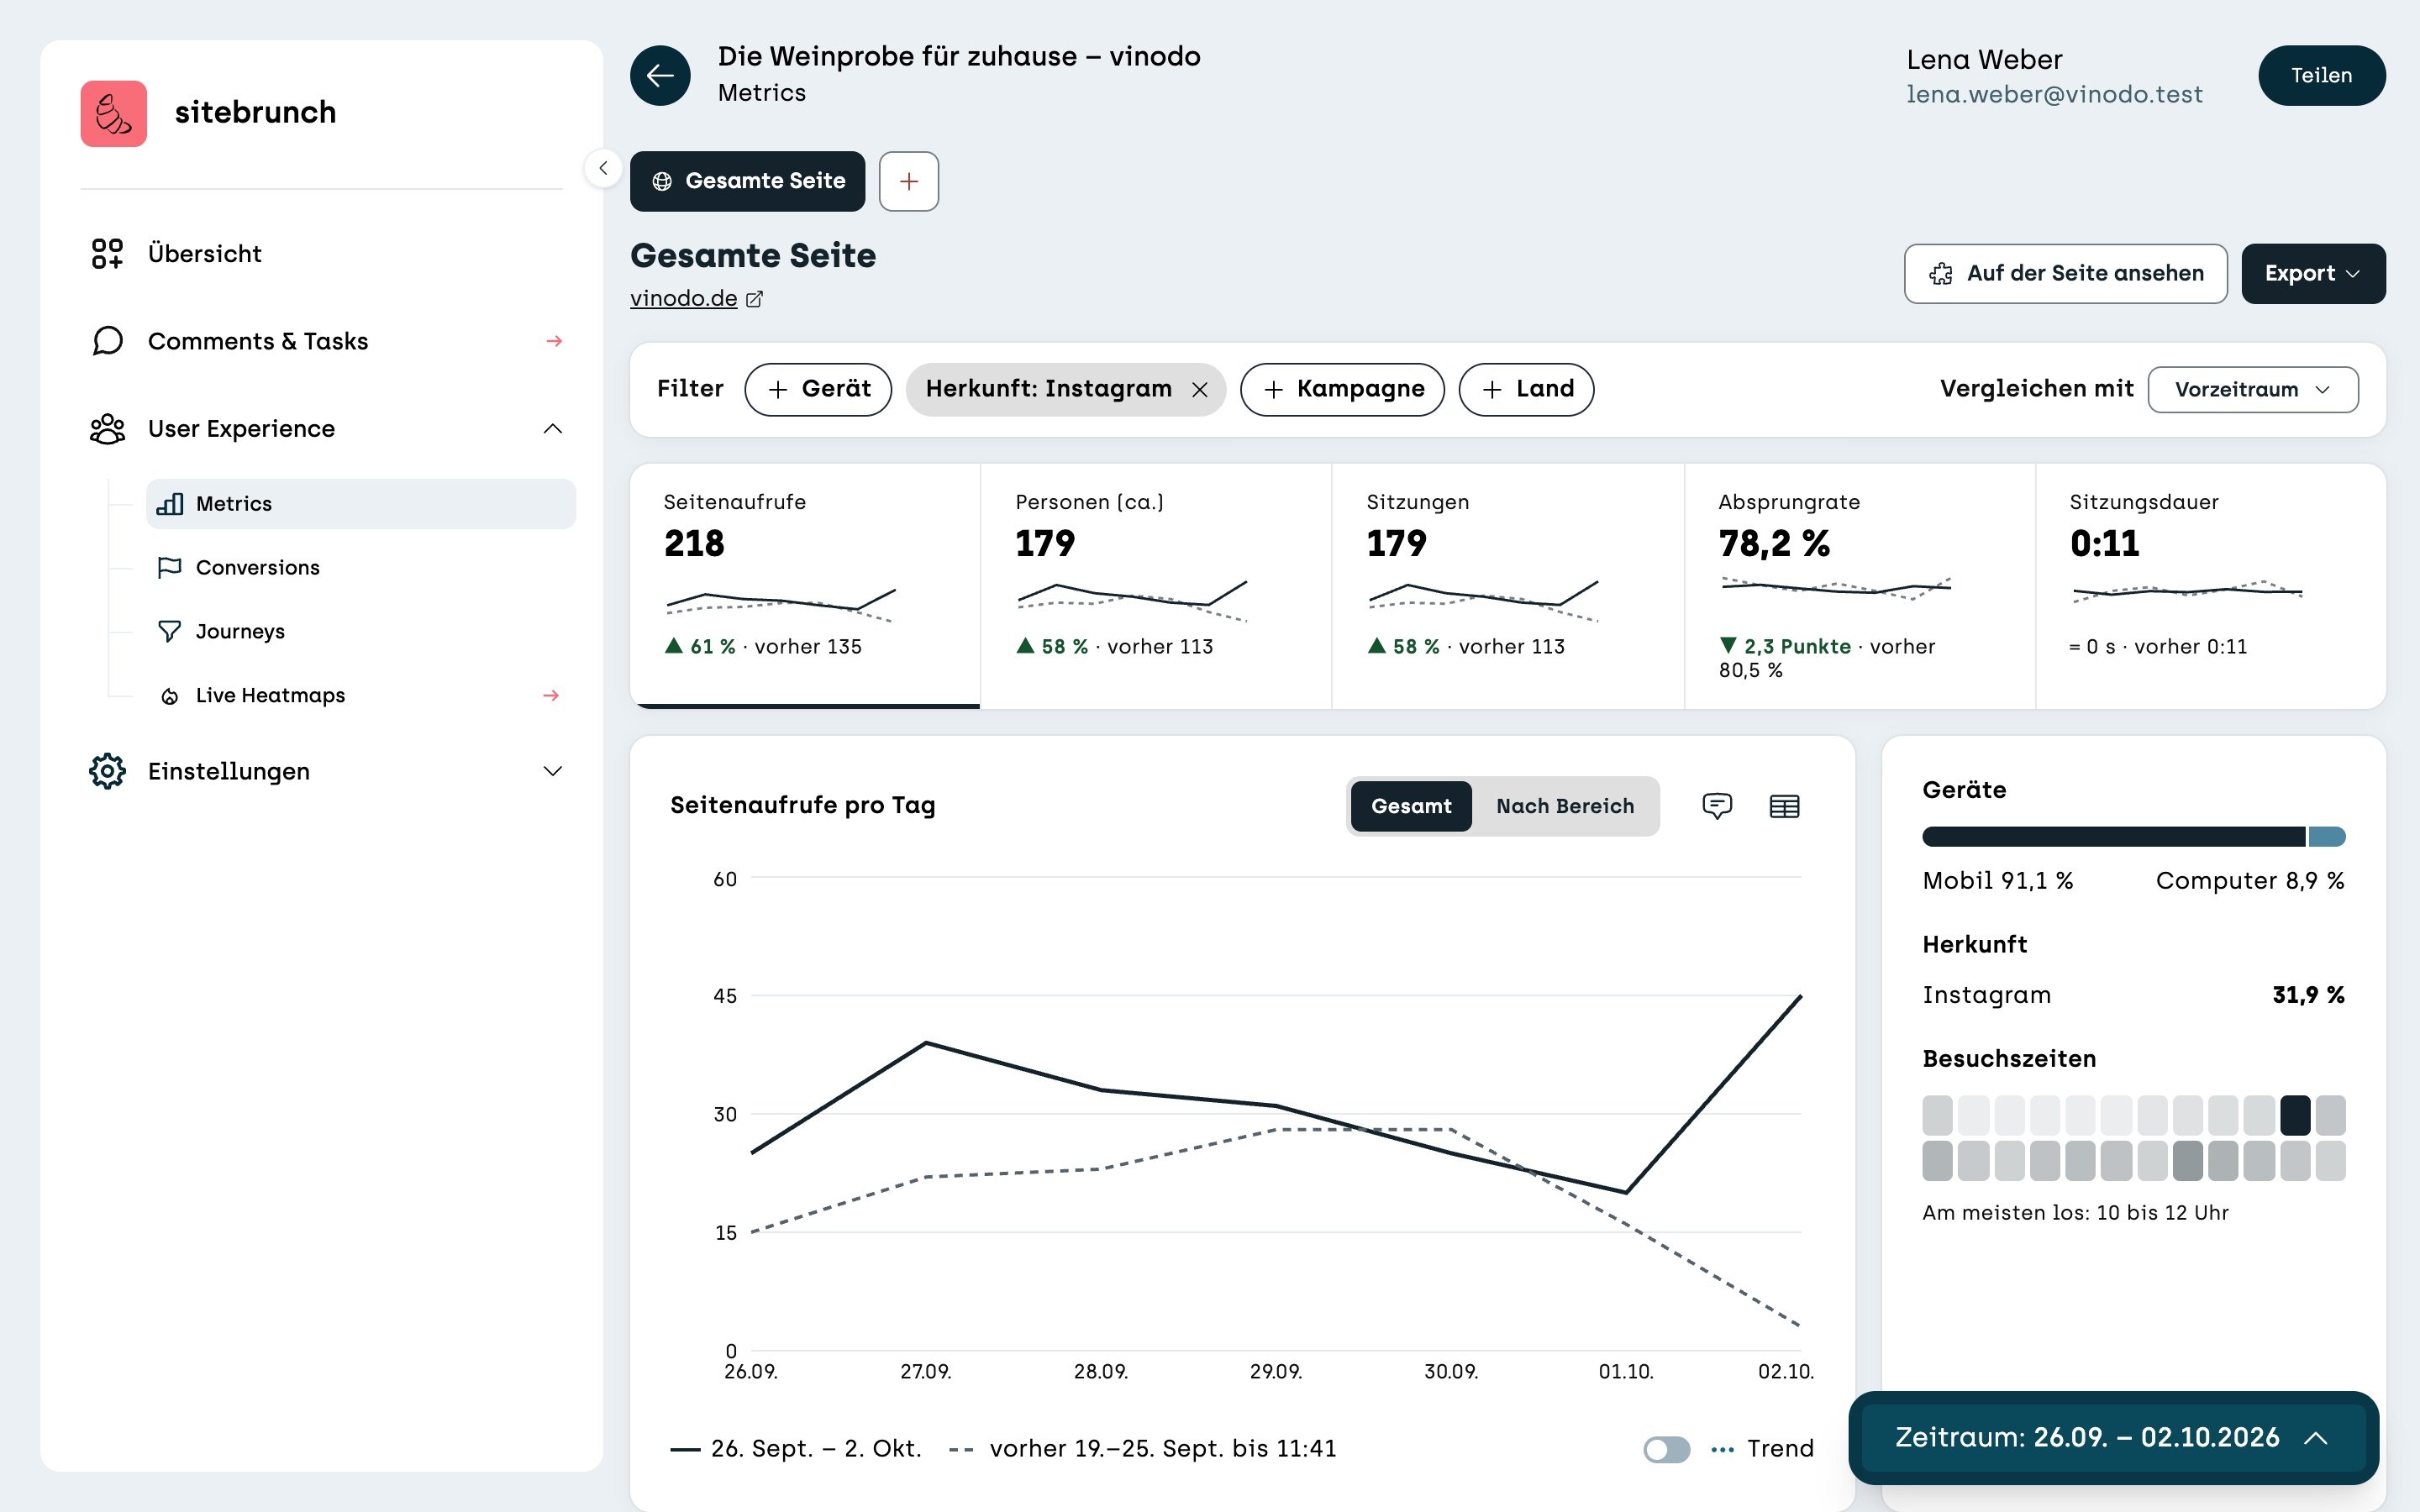
You remove the filter with the small x next to its name. The filtered view is stored in the link, so you can send it to your team as it is.
What you compare with
To the right of the filters, under “Compare with”, you set what the numbers are compared with. The default is “Previous period”, meaning the same number of days right before.
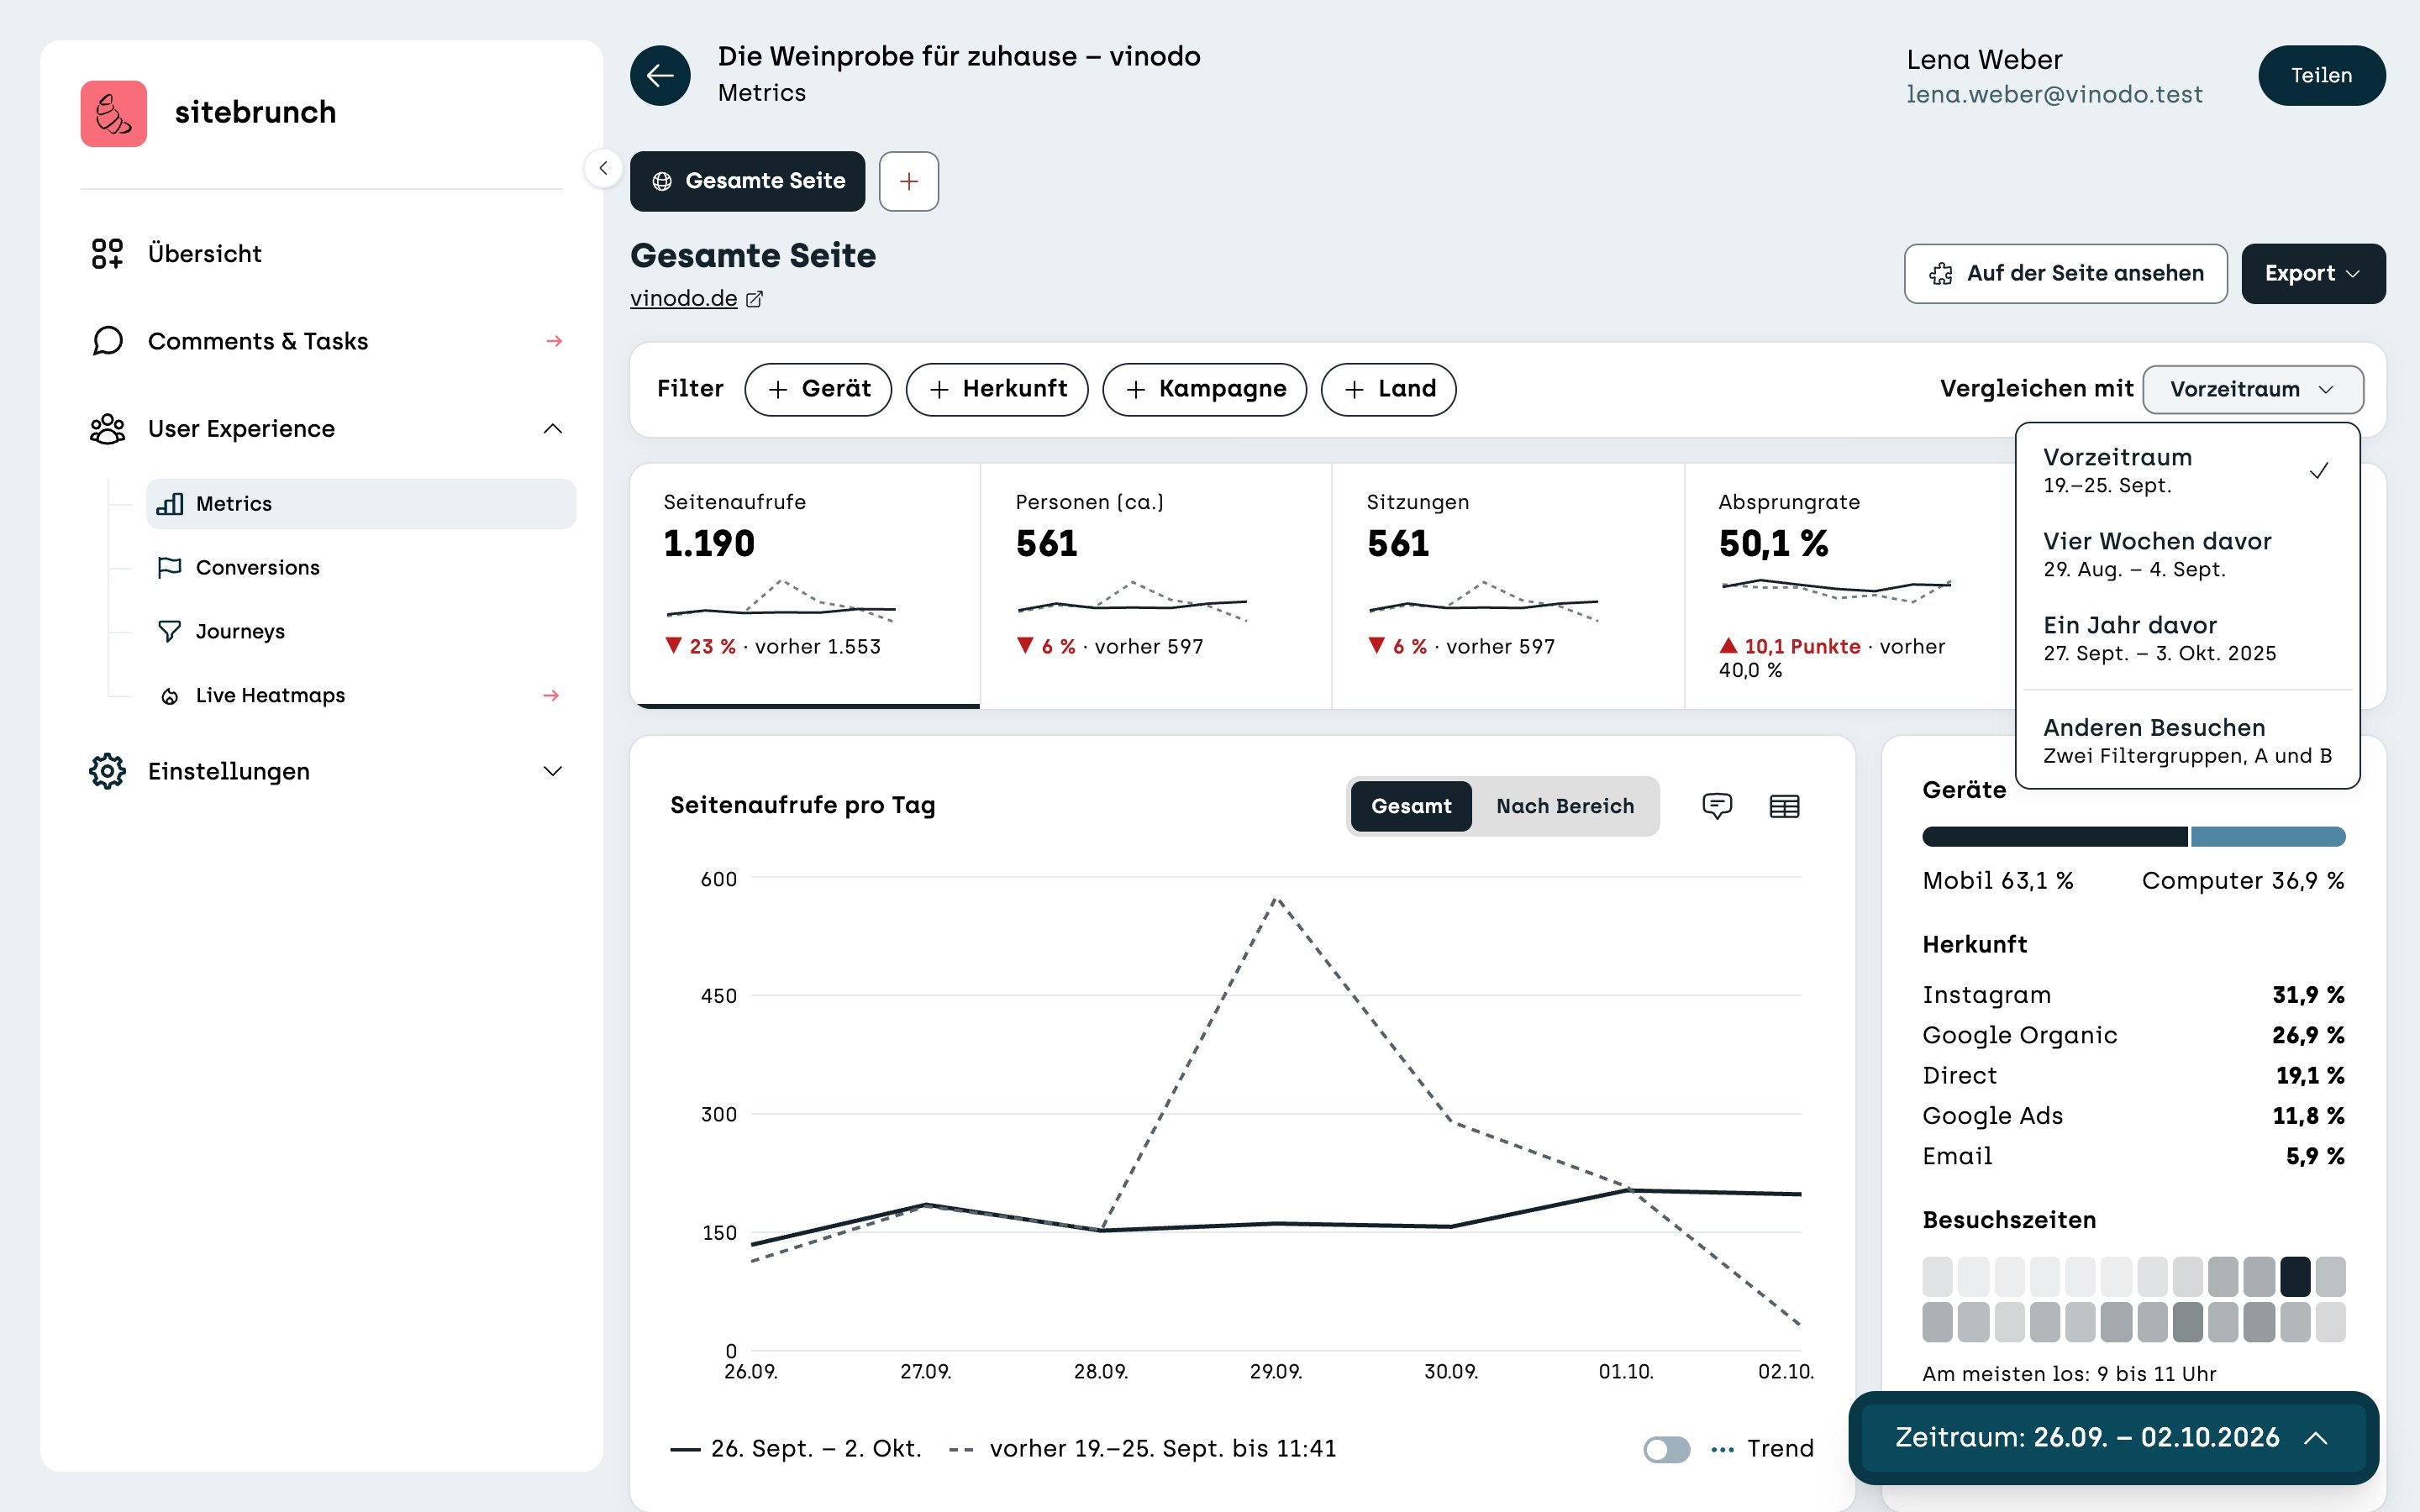
“Four weeks earlier” is useful if the week before was unusual, for example because of a promotion.
“One year earlier” shows you seasonal differences, such as during the Christmas season.
“Other visits” compares two filter groups with each other, for example phone versus computer.