Which pages get read and which don't? This article shows you the pages table, how to group pages into sections and how to view a section in its own tab.
Last updated: October 2, 2026
Requirements
You know the Metrics overview.
The pages table
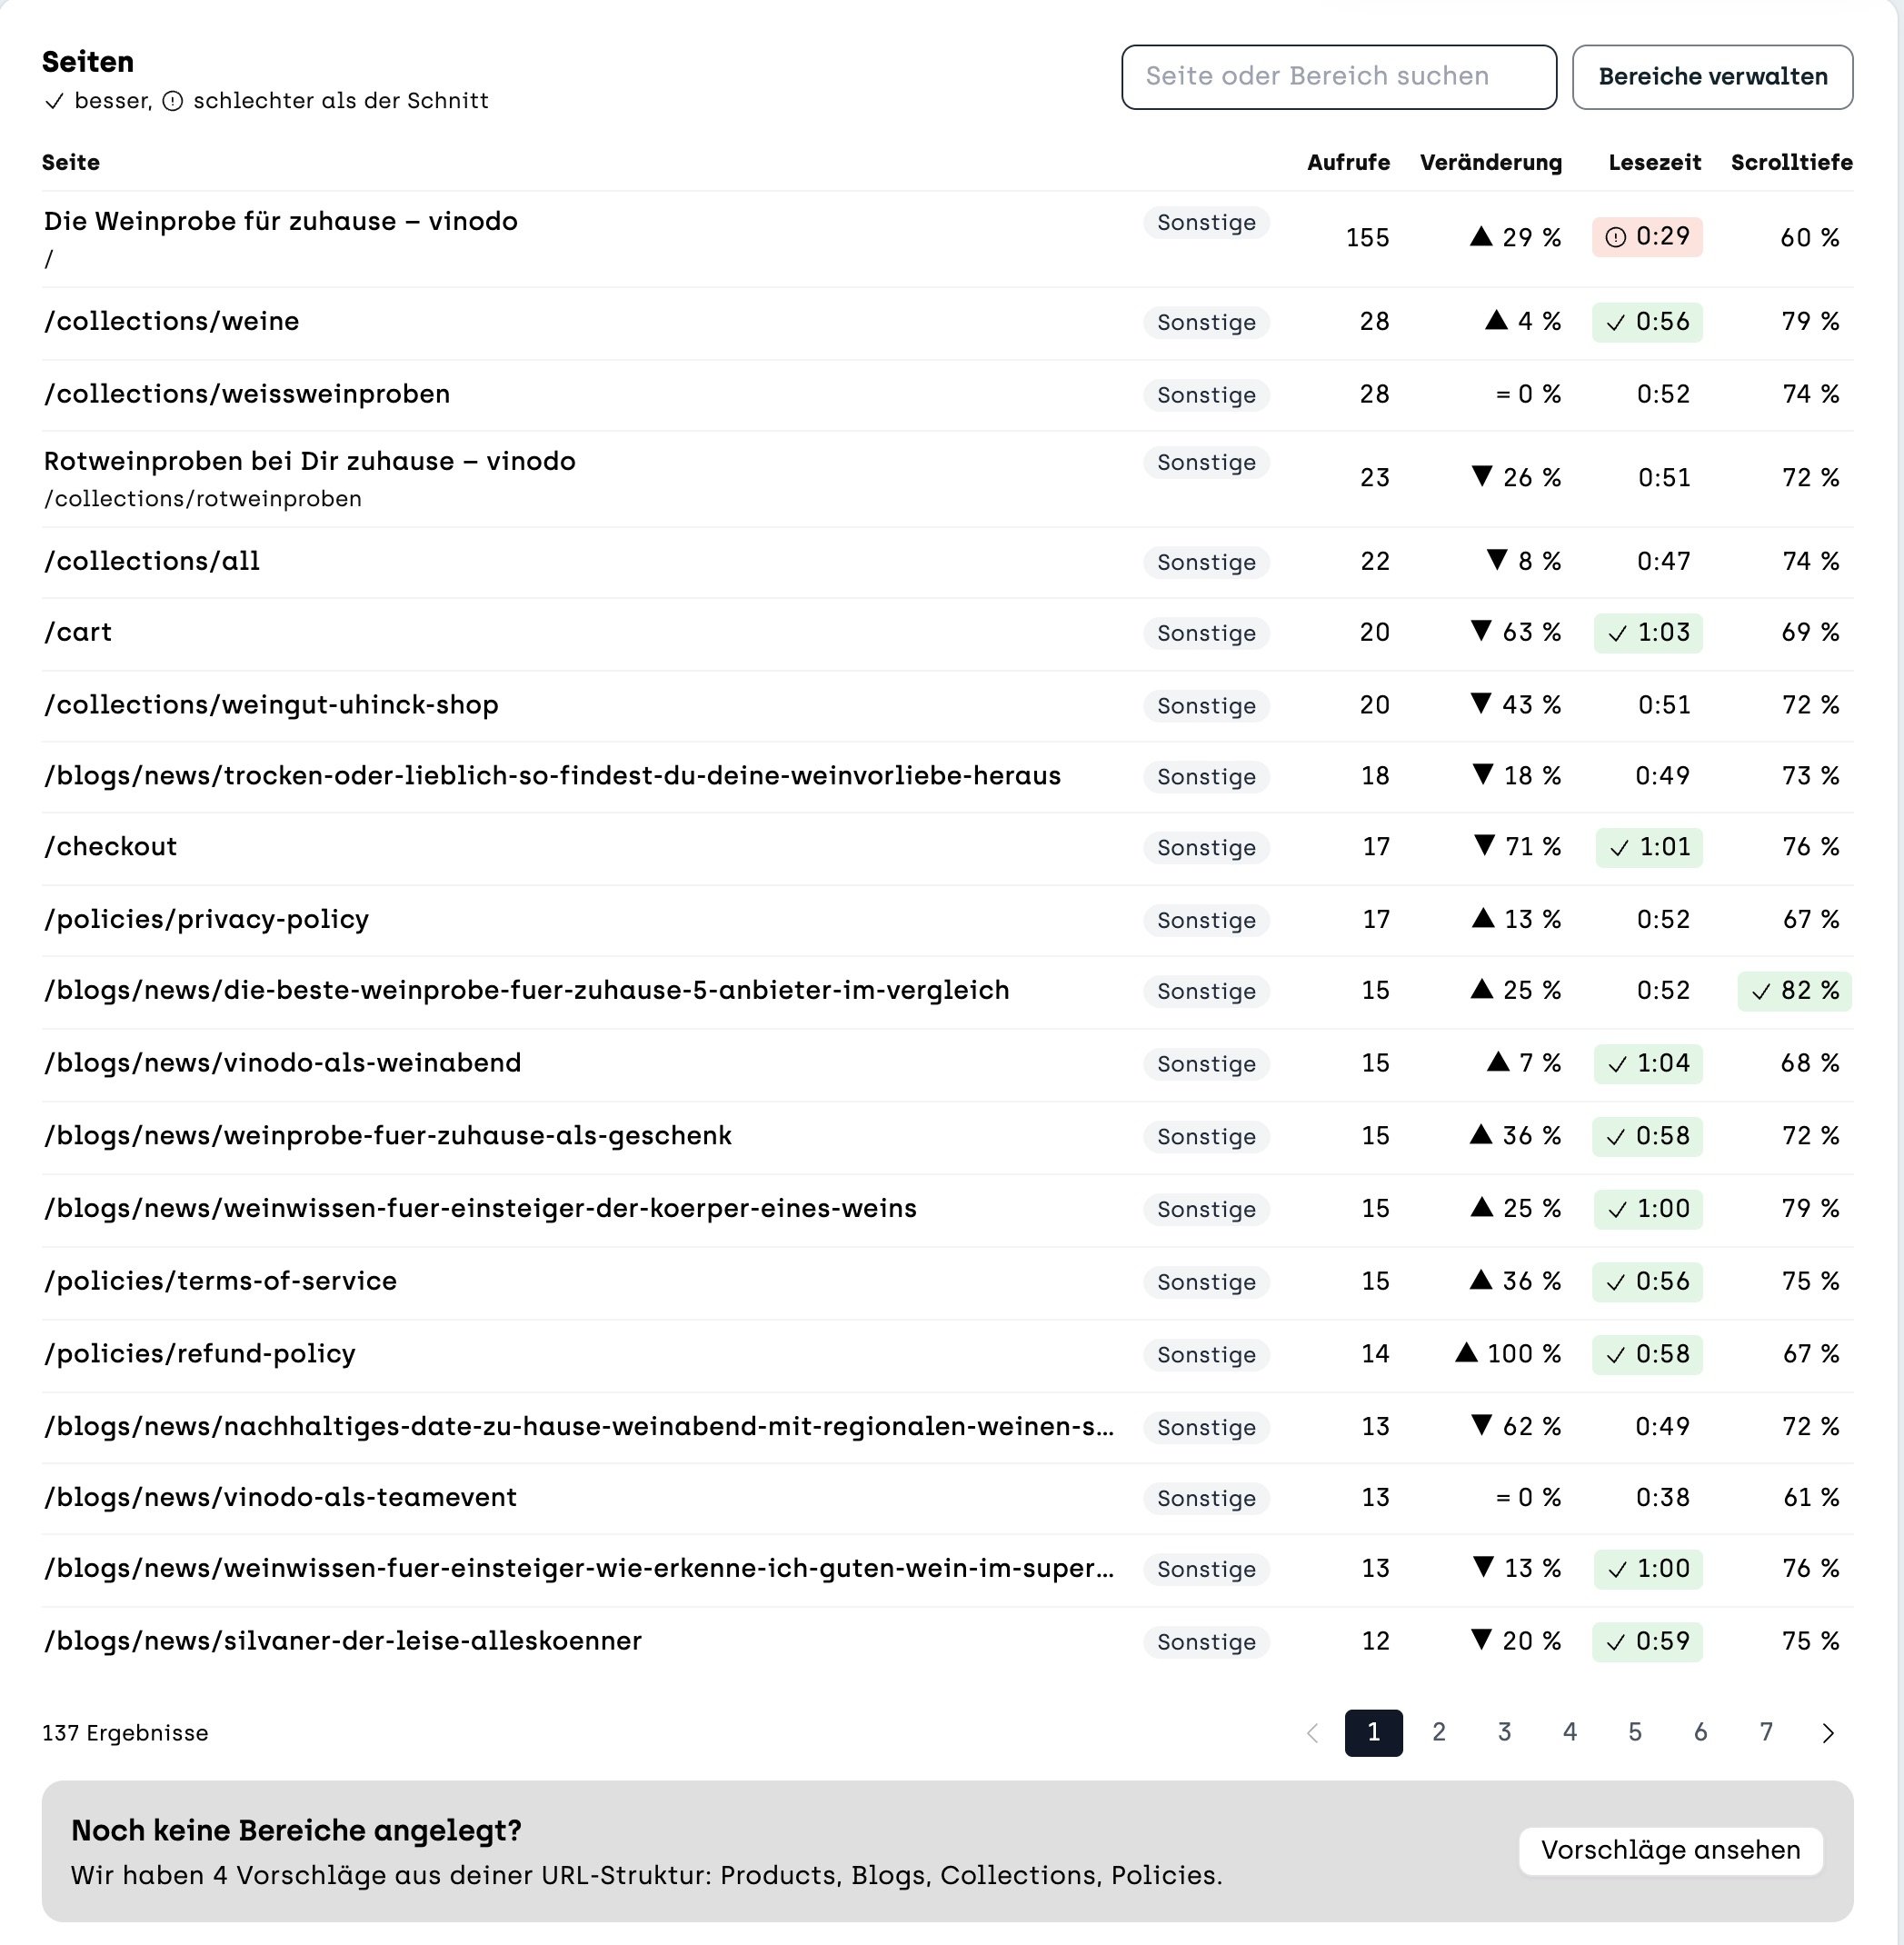
Below the chart, the “Pages” table lists every page of your website with its views. Next to that you see the change compared with the comparison period, the reading time and how far visitors scroll down on average.
A green check mark means: better than your website's average. A red exclamation mark means: worse than average. Use the search field to find a specific page.
Create sections
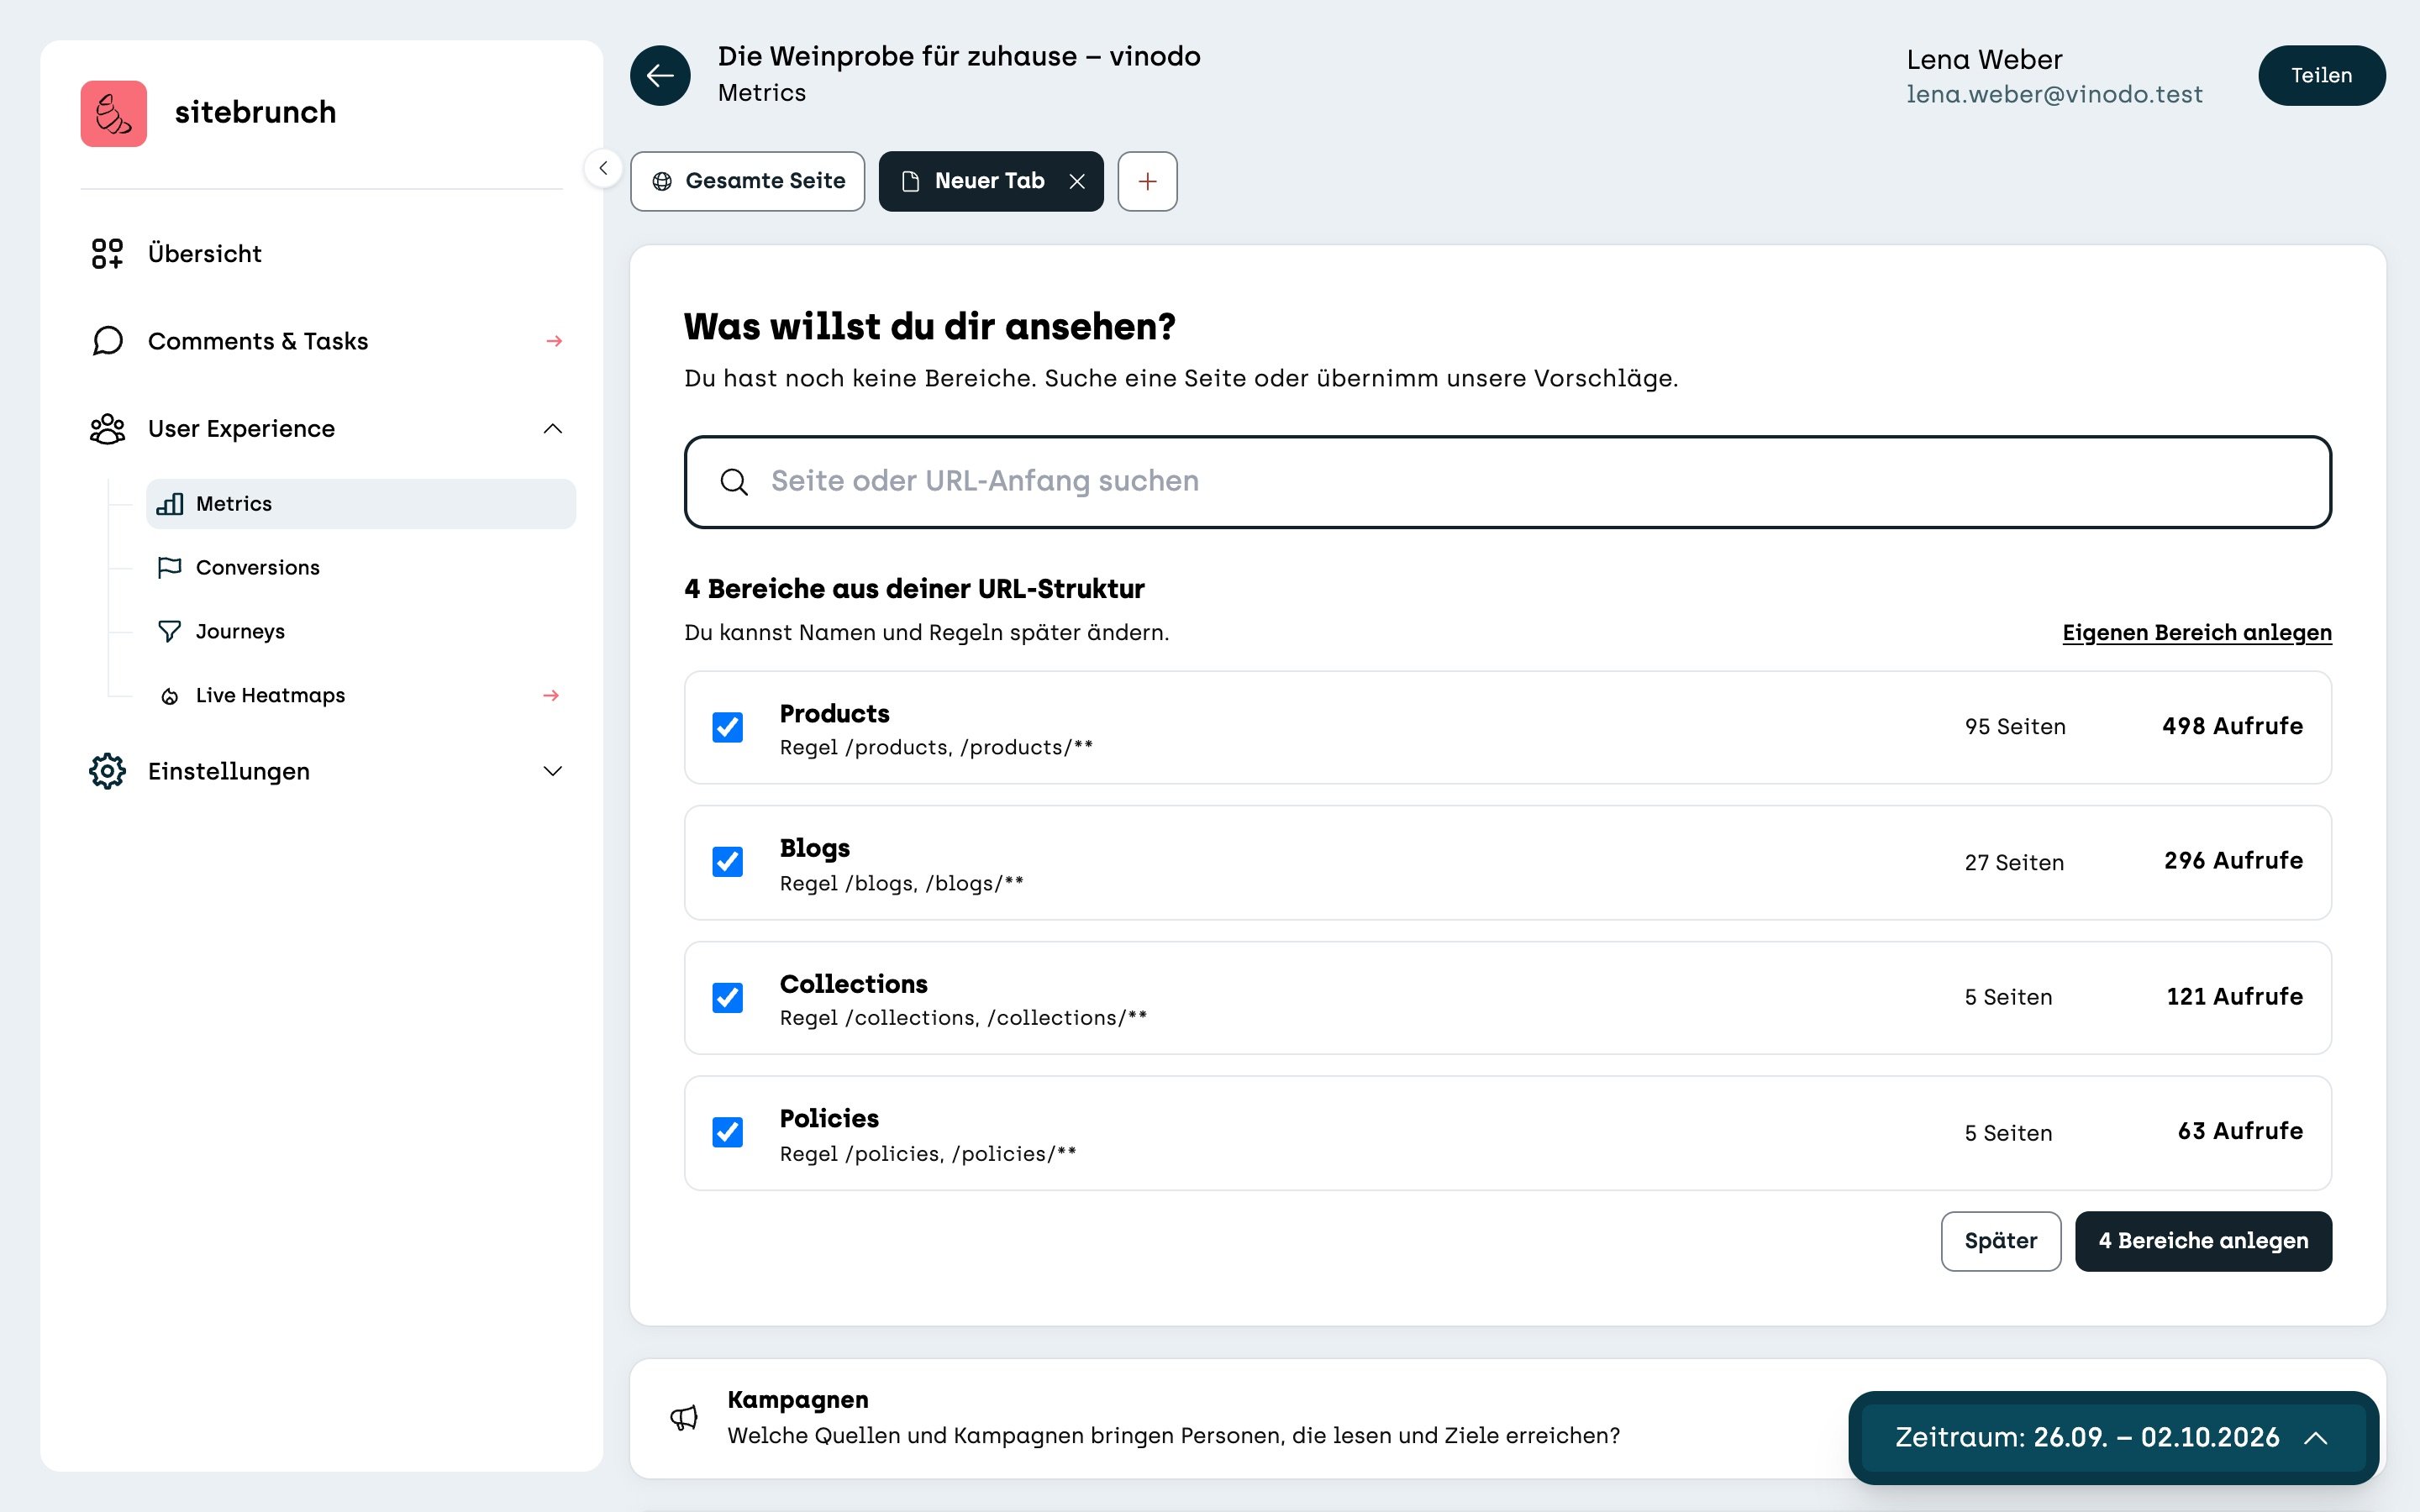
Sections group pages that belong together, for example all product pages or all blog articles. sitebrunch suggests suitable sections based on the structure of your addresses. To see them, click “View suggestions” below the table.
Tick the sections you want and click “Create sections”. You can change names and rules later under “Manage sections”.
View by section
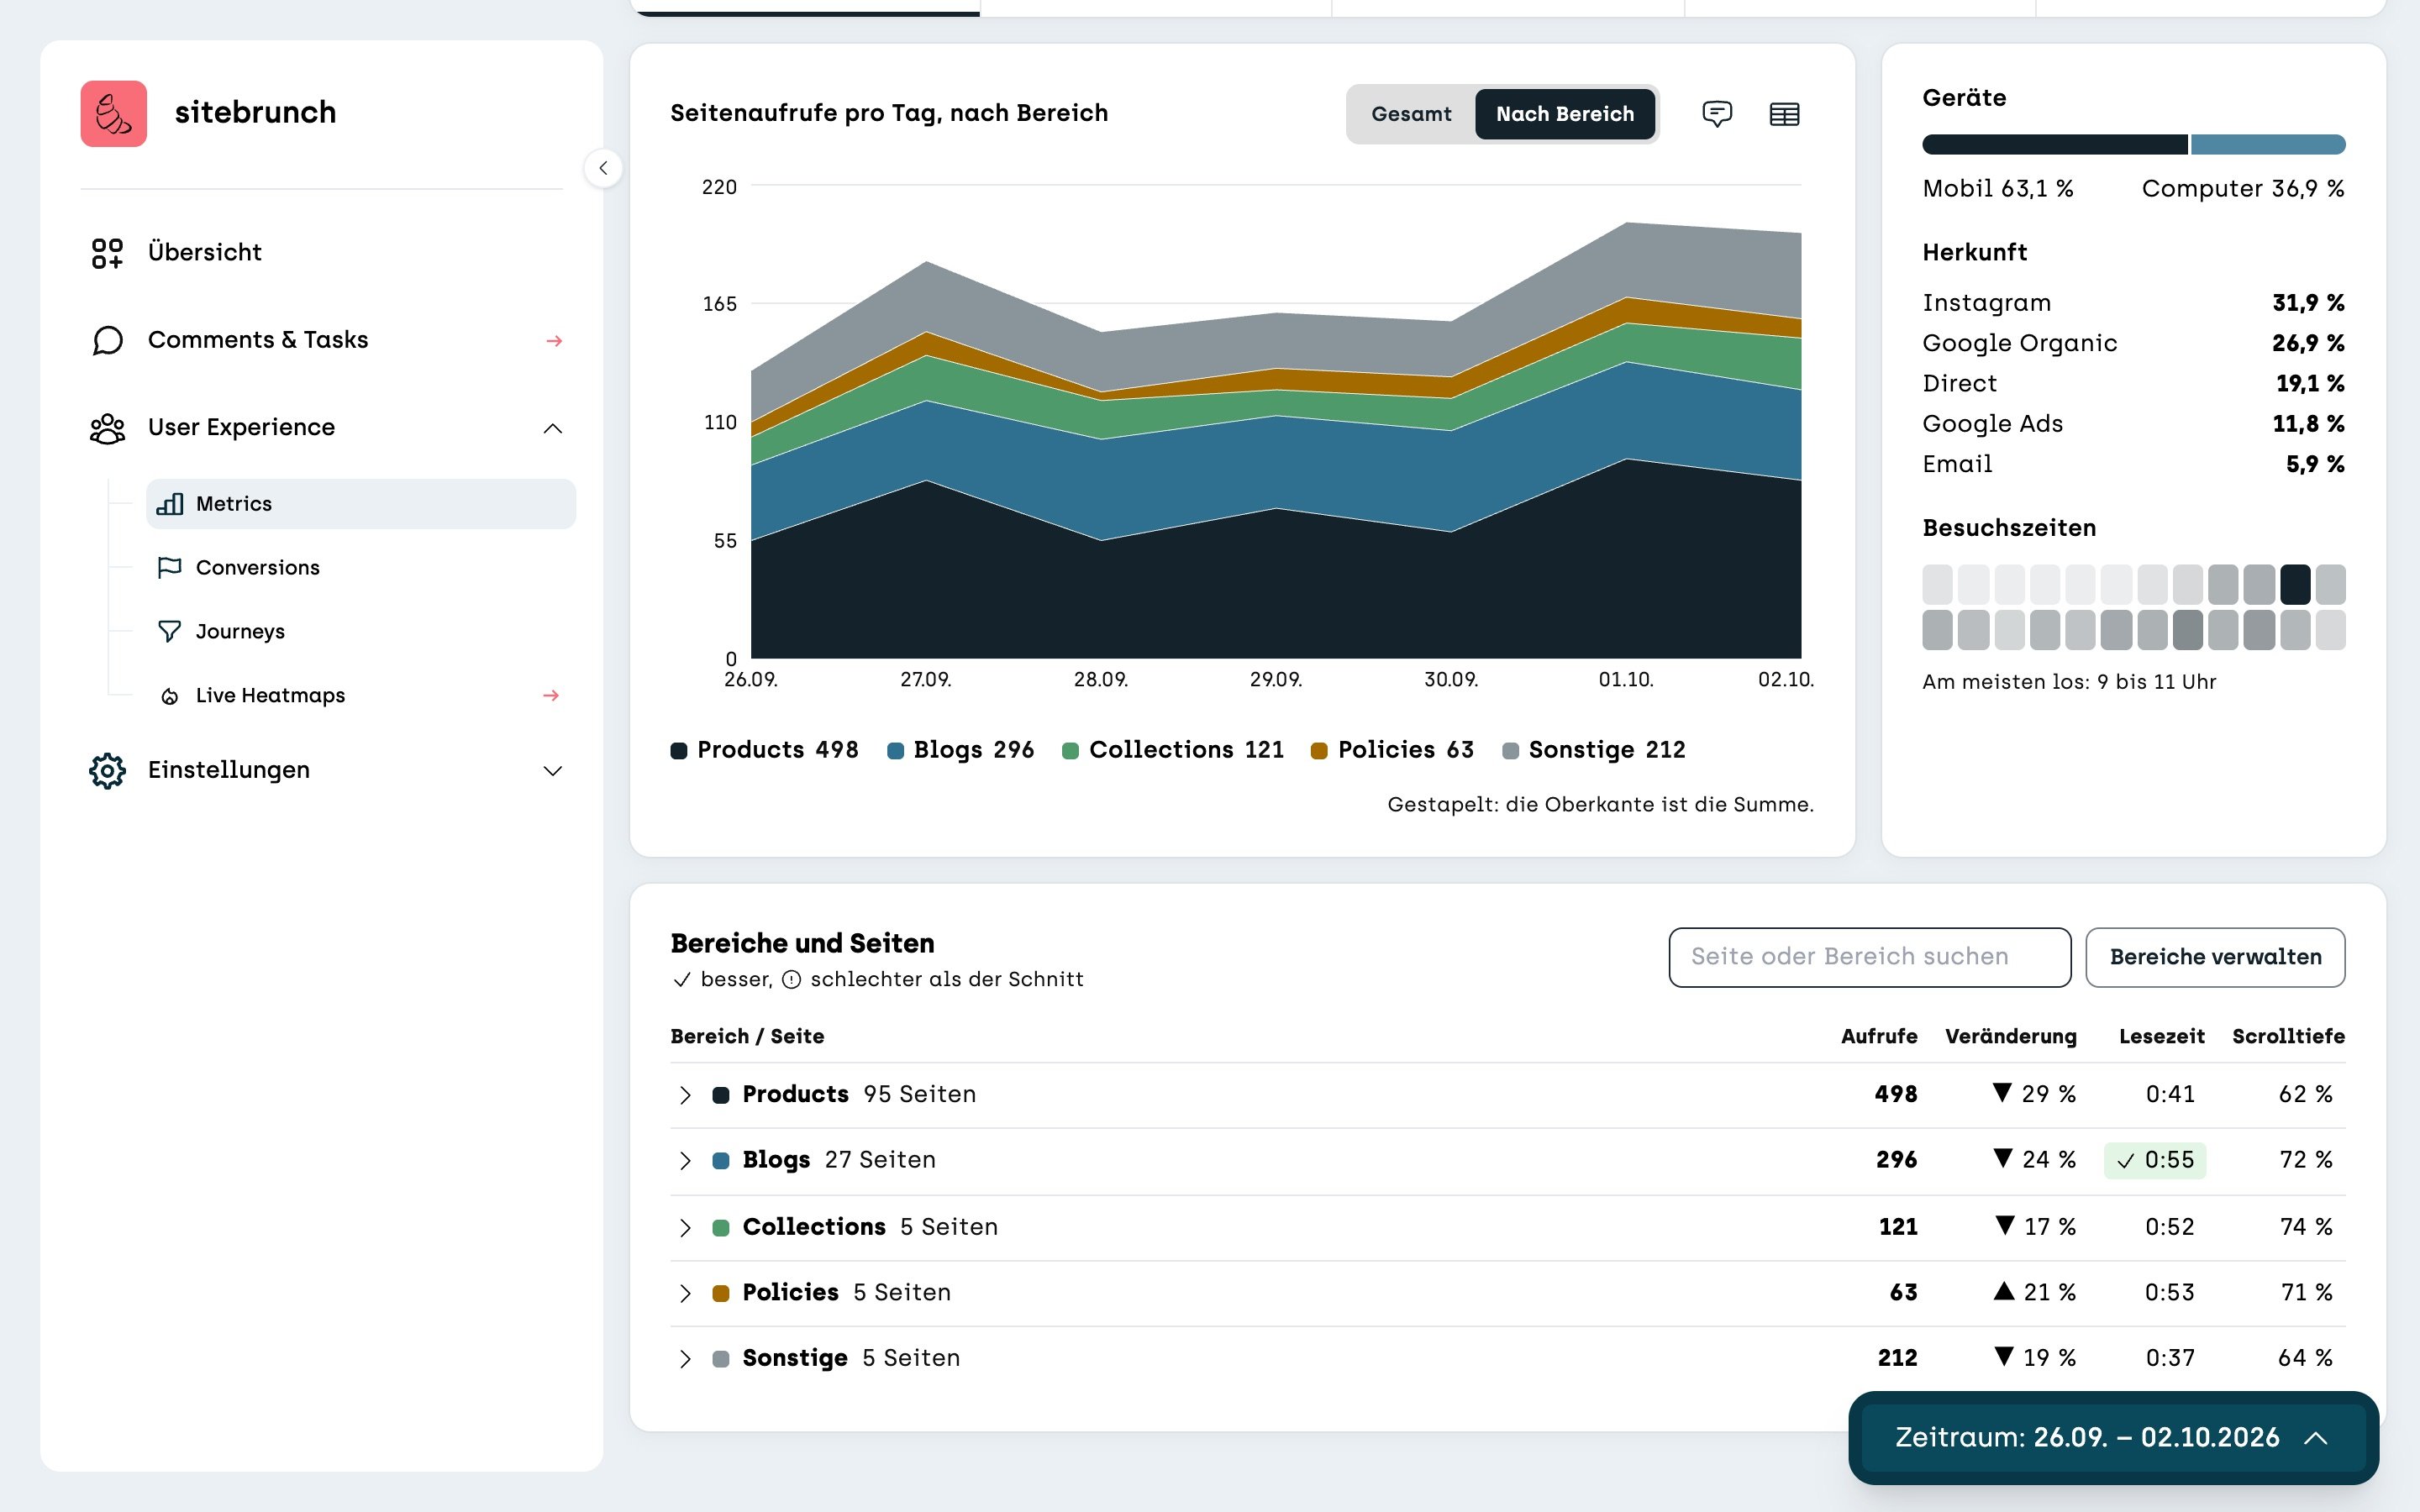
Once you have sections, switch the chart at the top to “By section”. You then see the views per day stacked by section. The top edge is the total. The table is now called “Sections and pages” and shows one row per section. Use the arrow in front of a section to expand its pages.
Open a section as its own tab
At the top, click the plus next to “Complete site”. Choose a section on the left or a single page on the right. The search field also finds pages that aren't in the list.
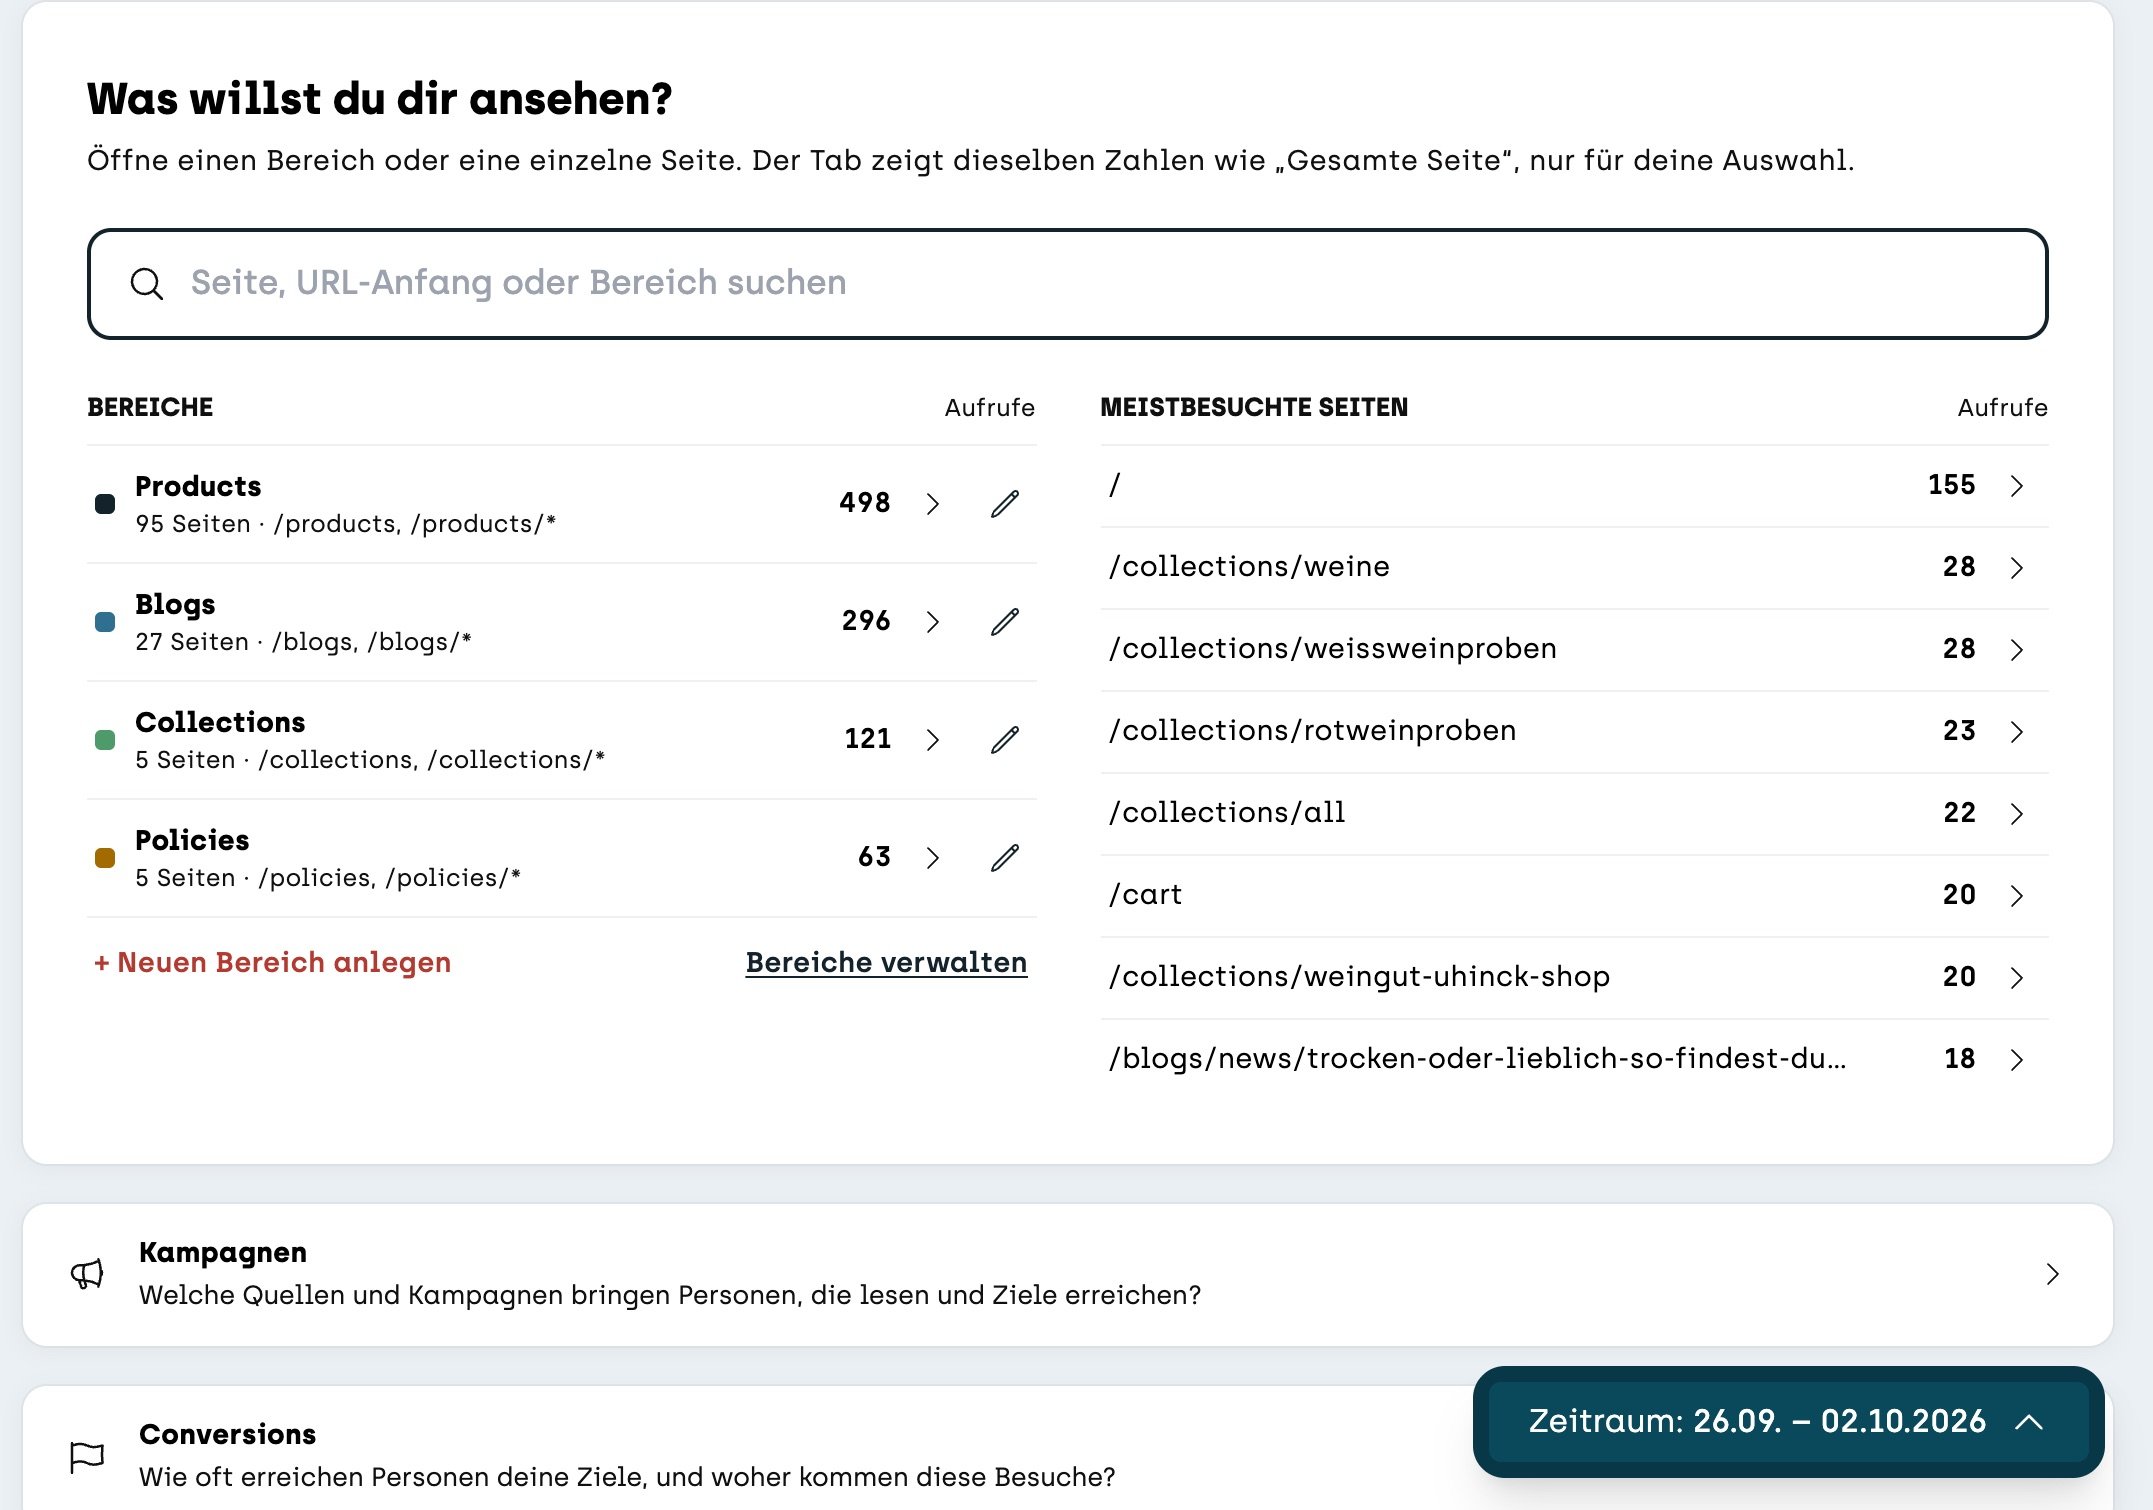
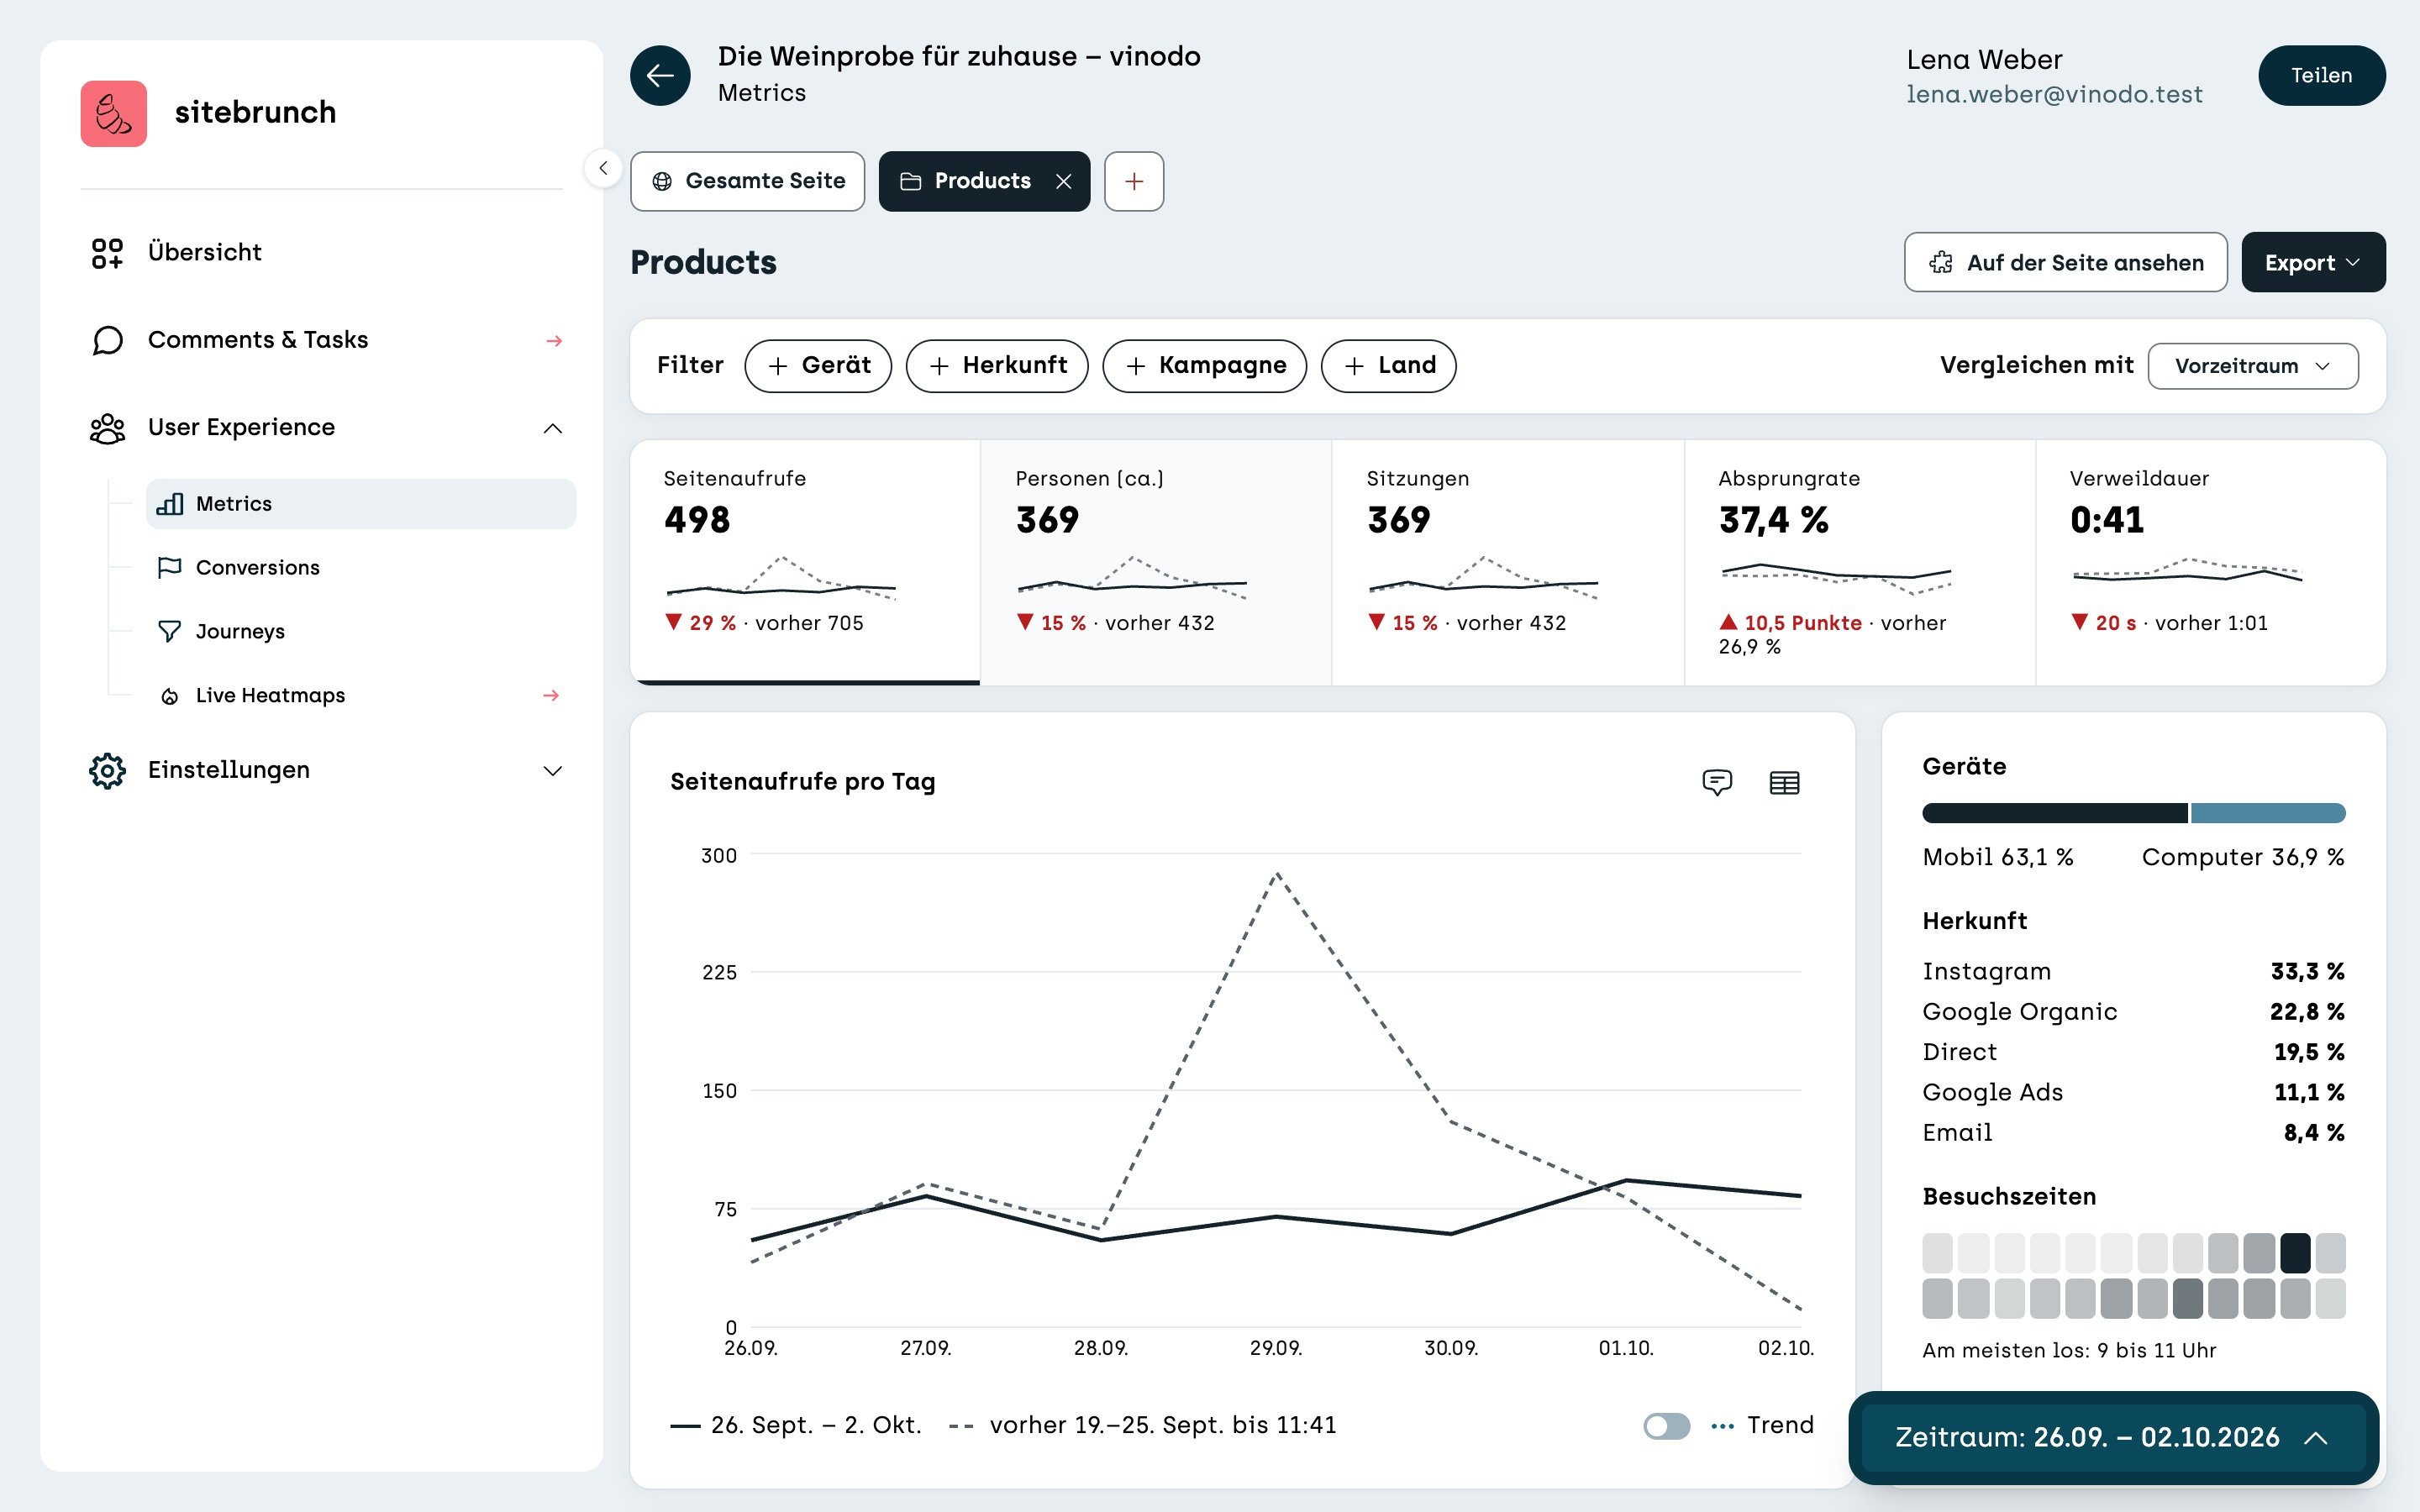
The new tab shows the same numbers as “Complete site”, just for your selection. For example, you can see that the product pages of vinodo.de have a clearly lower bounce rate than the website as a whole. Close the tab again with the x on it.