Which sources and campaigns bring visitors who actually read and buy? This article shows you how to find out in the “Campaigns” tab.
Last updated: October 2, 2026
Requirements
You know the Metrics overview.
Your links in newsletters, ads and social media have UTM parameters. You can use our free UTM link generator for this.
For the “Goals” column, you have created at least one goal.
Open the tab
In Metrics, click the plus at the top and choose “Campaigns”.
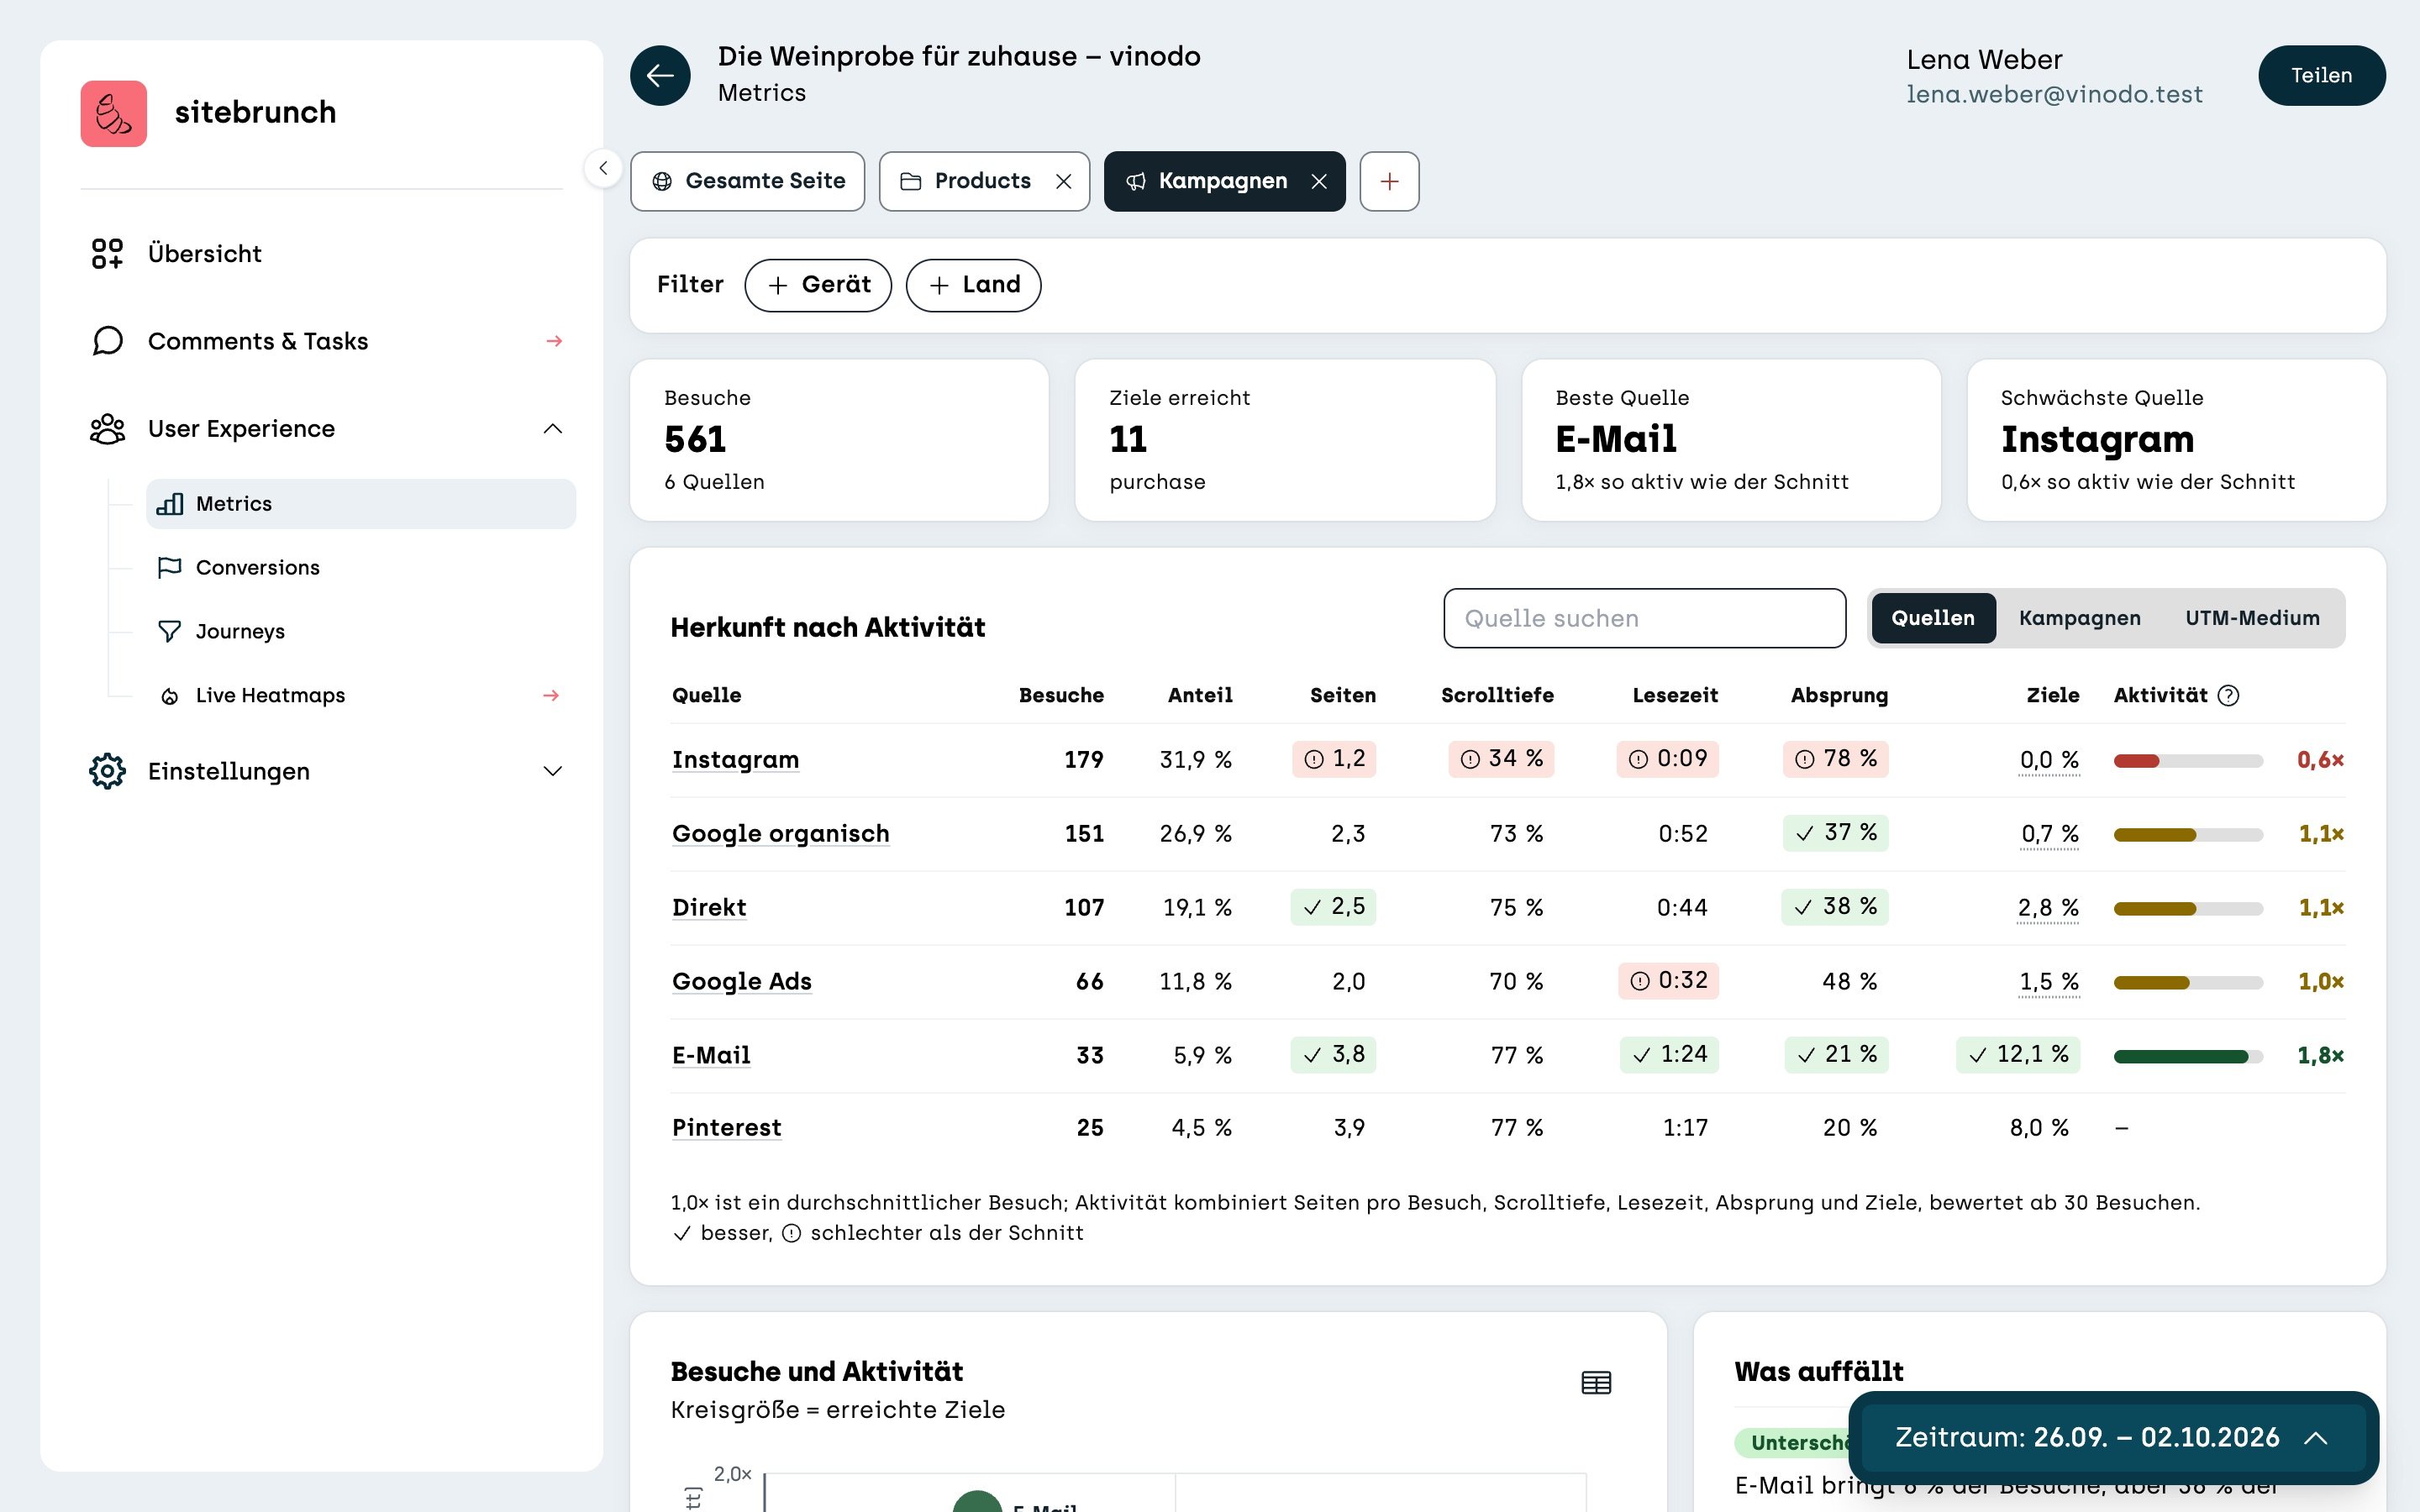
At the top you see four tiles: all “Visits”, the “Goals reached”, the “Best source” and the “Weakest source”. For vinodo.de, email brings the most active visits and Instagram the weakest.
Traffic by activity
The table shows for each source how many visits it brings and what those visits do: how many pages they view, how far they scroll, how long they read, how often they leave right away and how often they reach a goal.
The “Activity” column sums this up in one number. 1.0x is an average visit. A source is rated from 30 visits.
Sources, campaigns and UTM medium
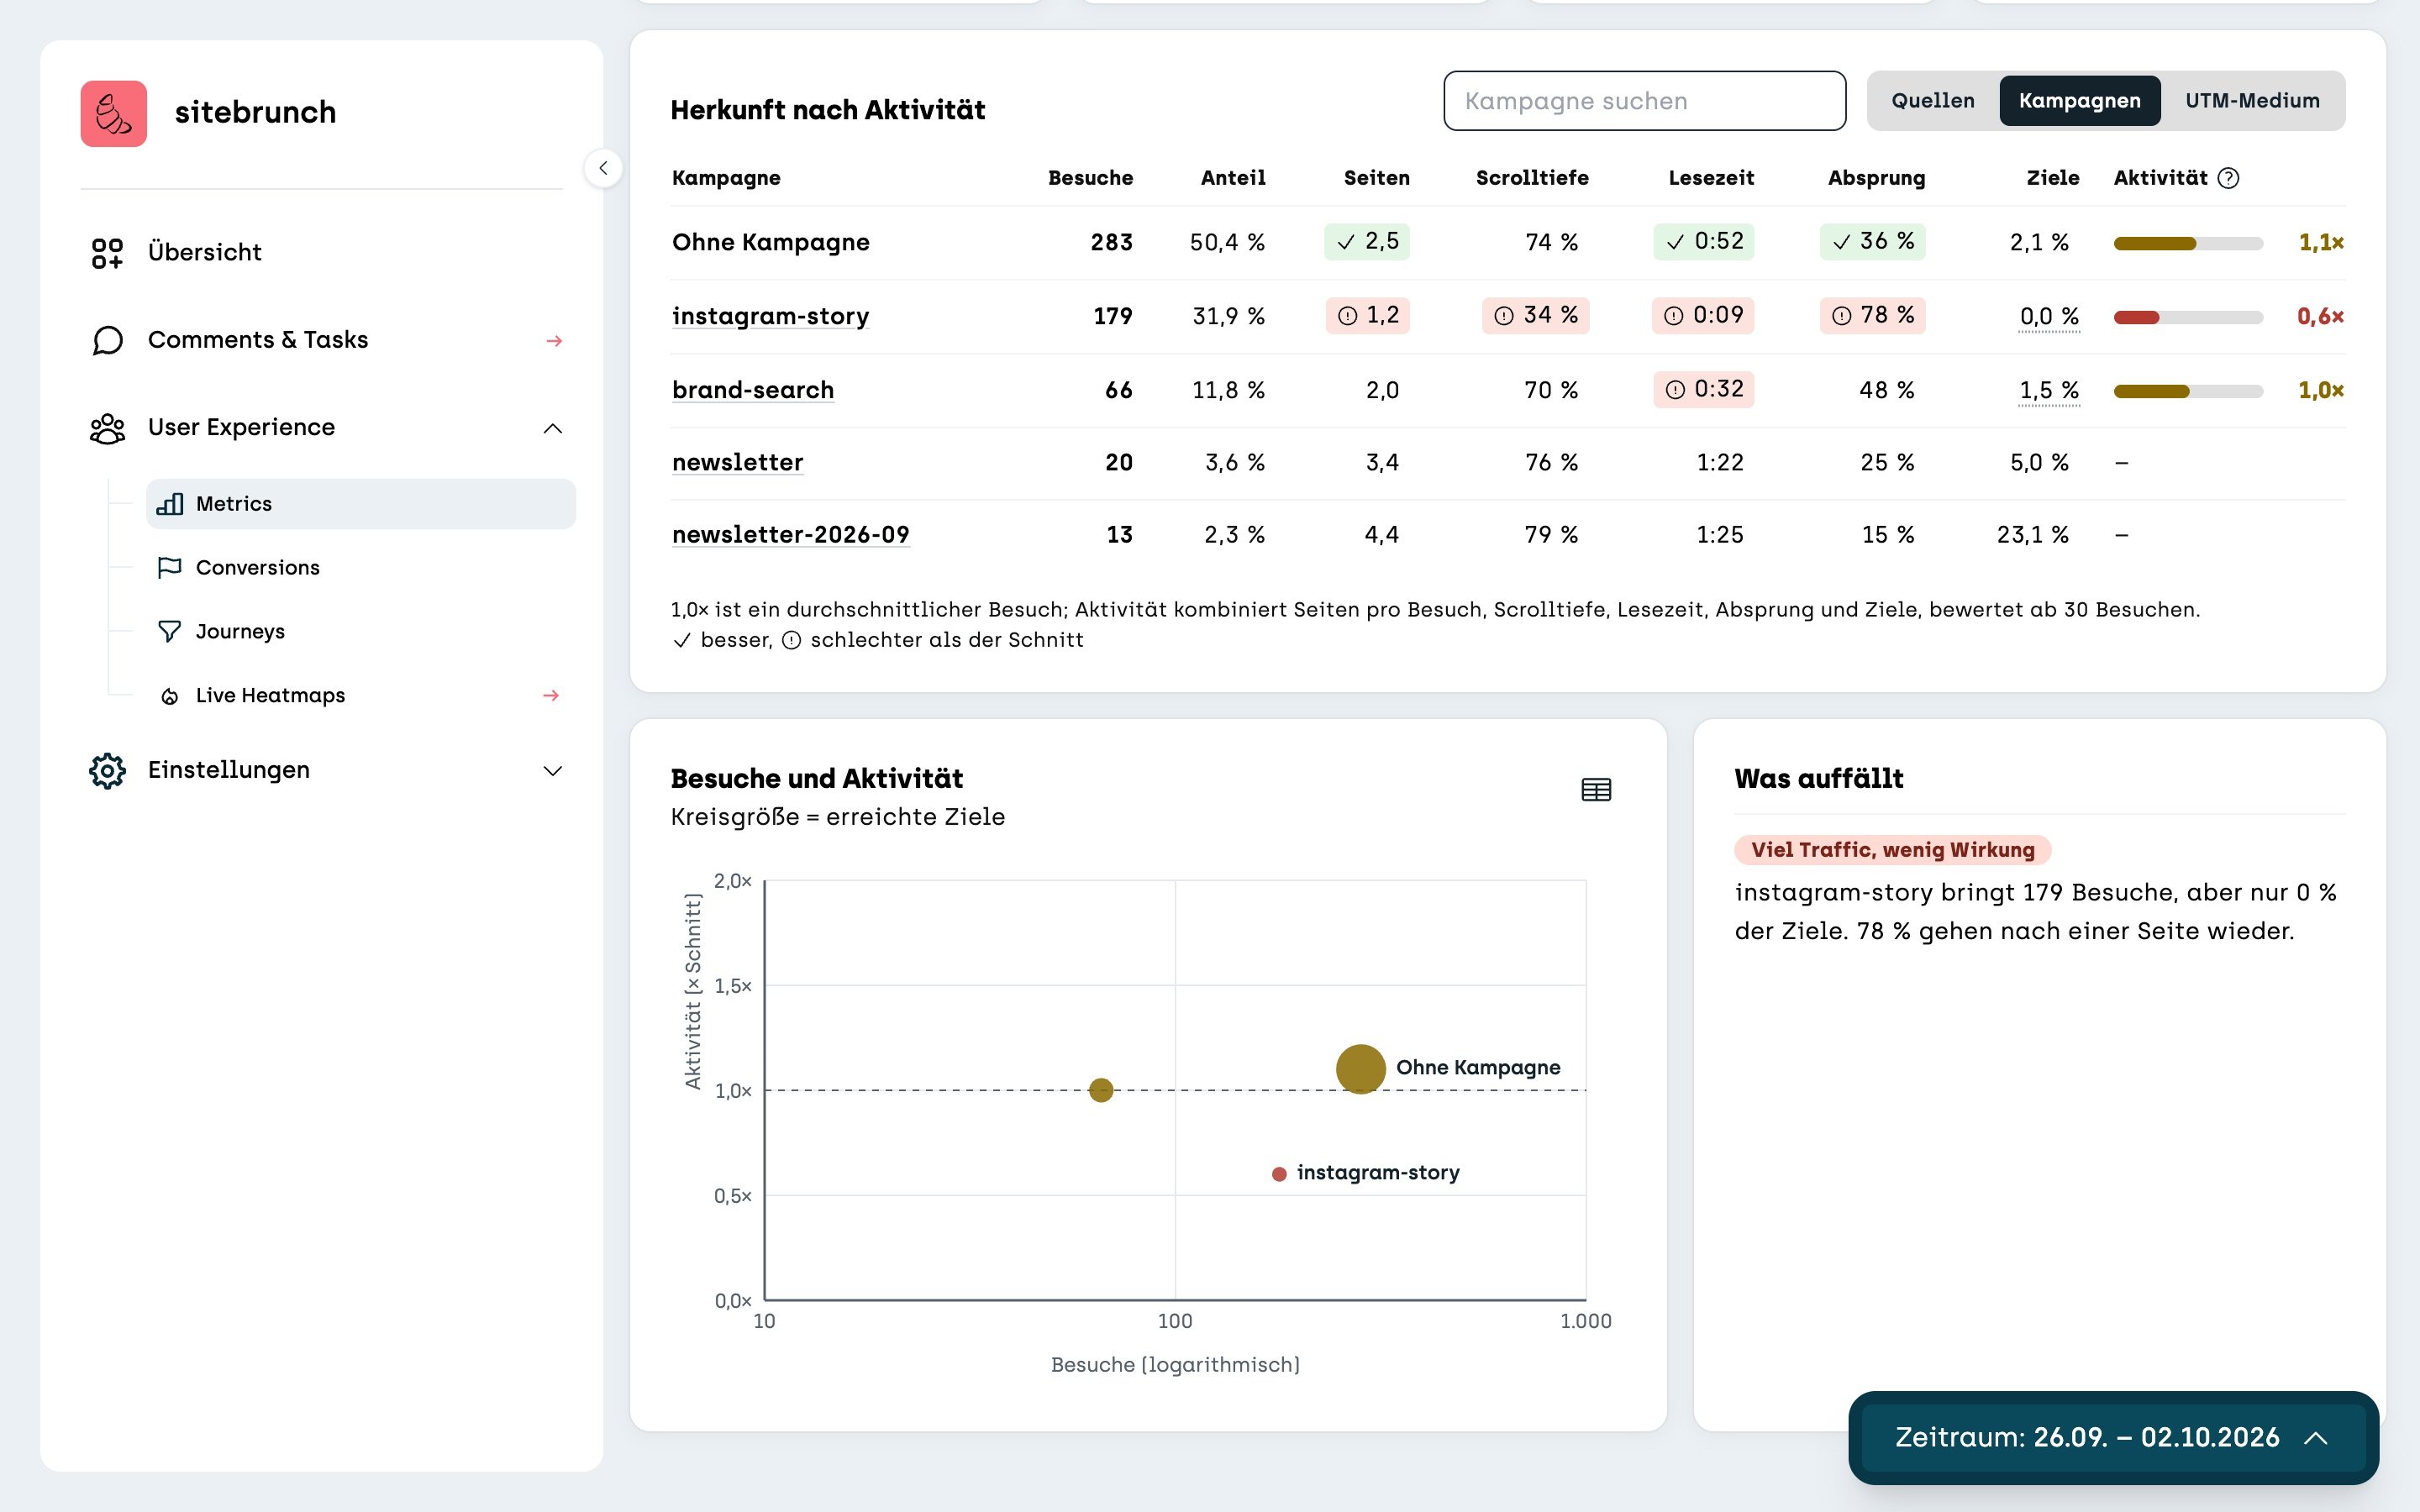
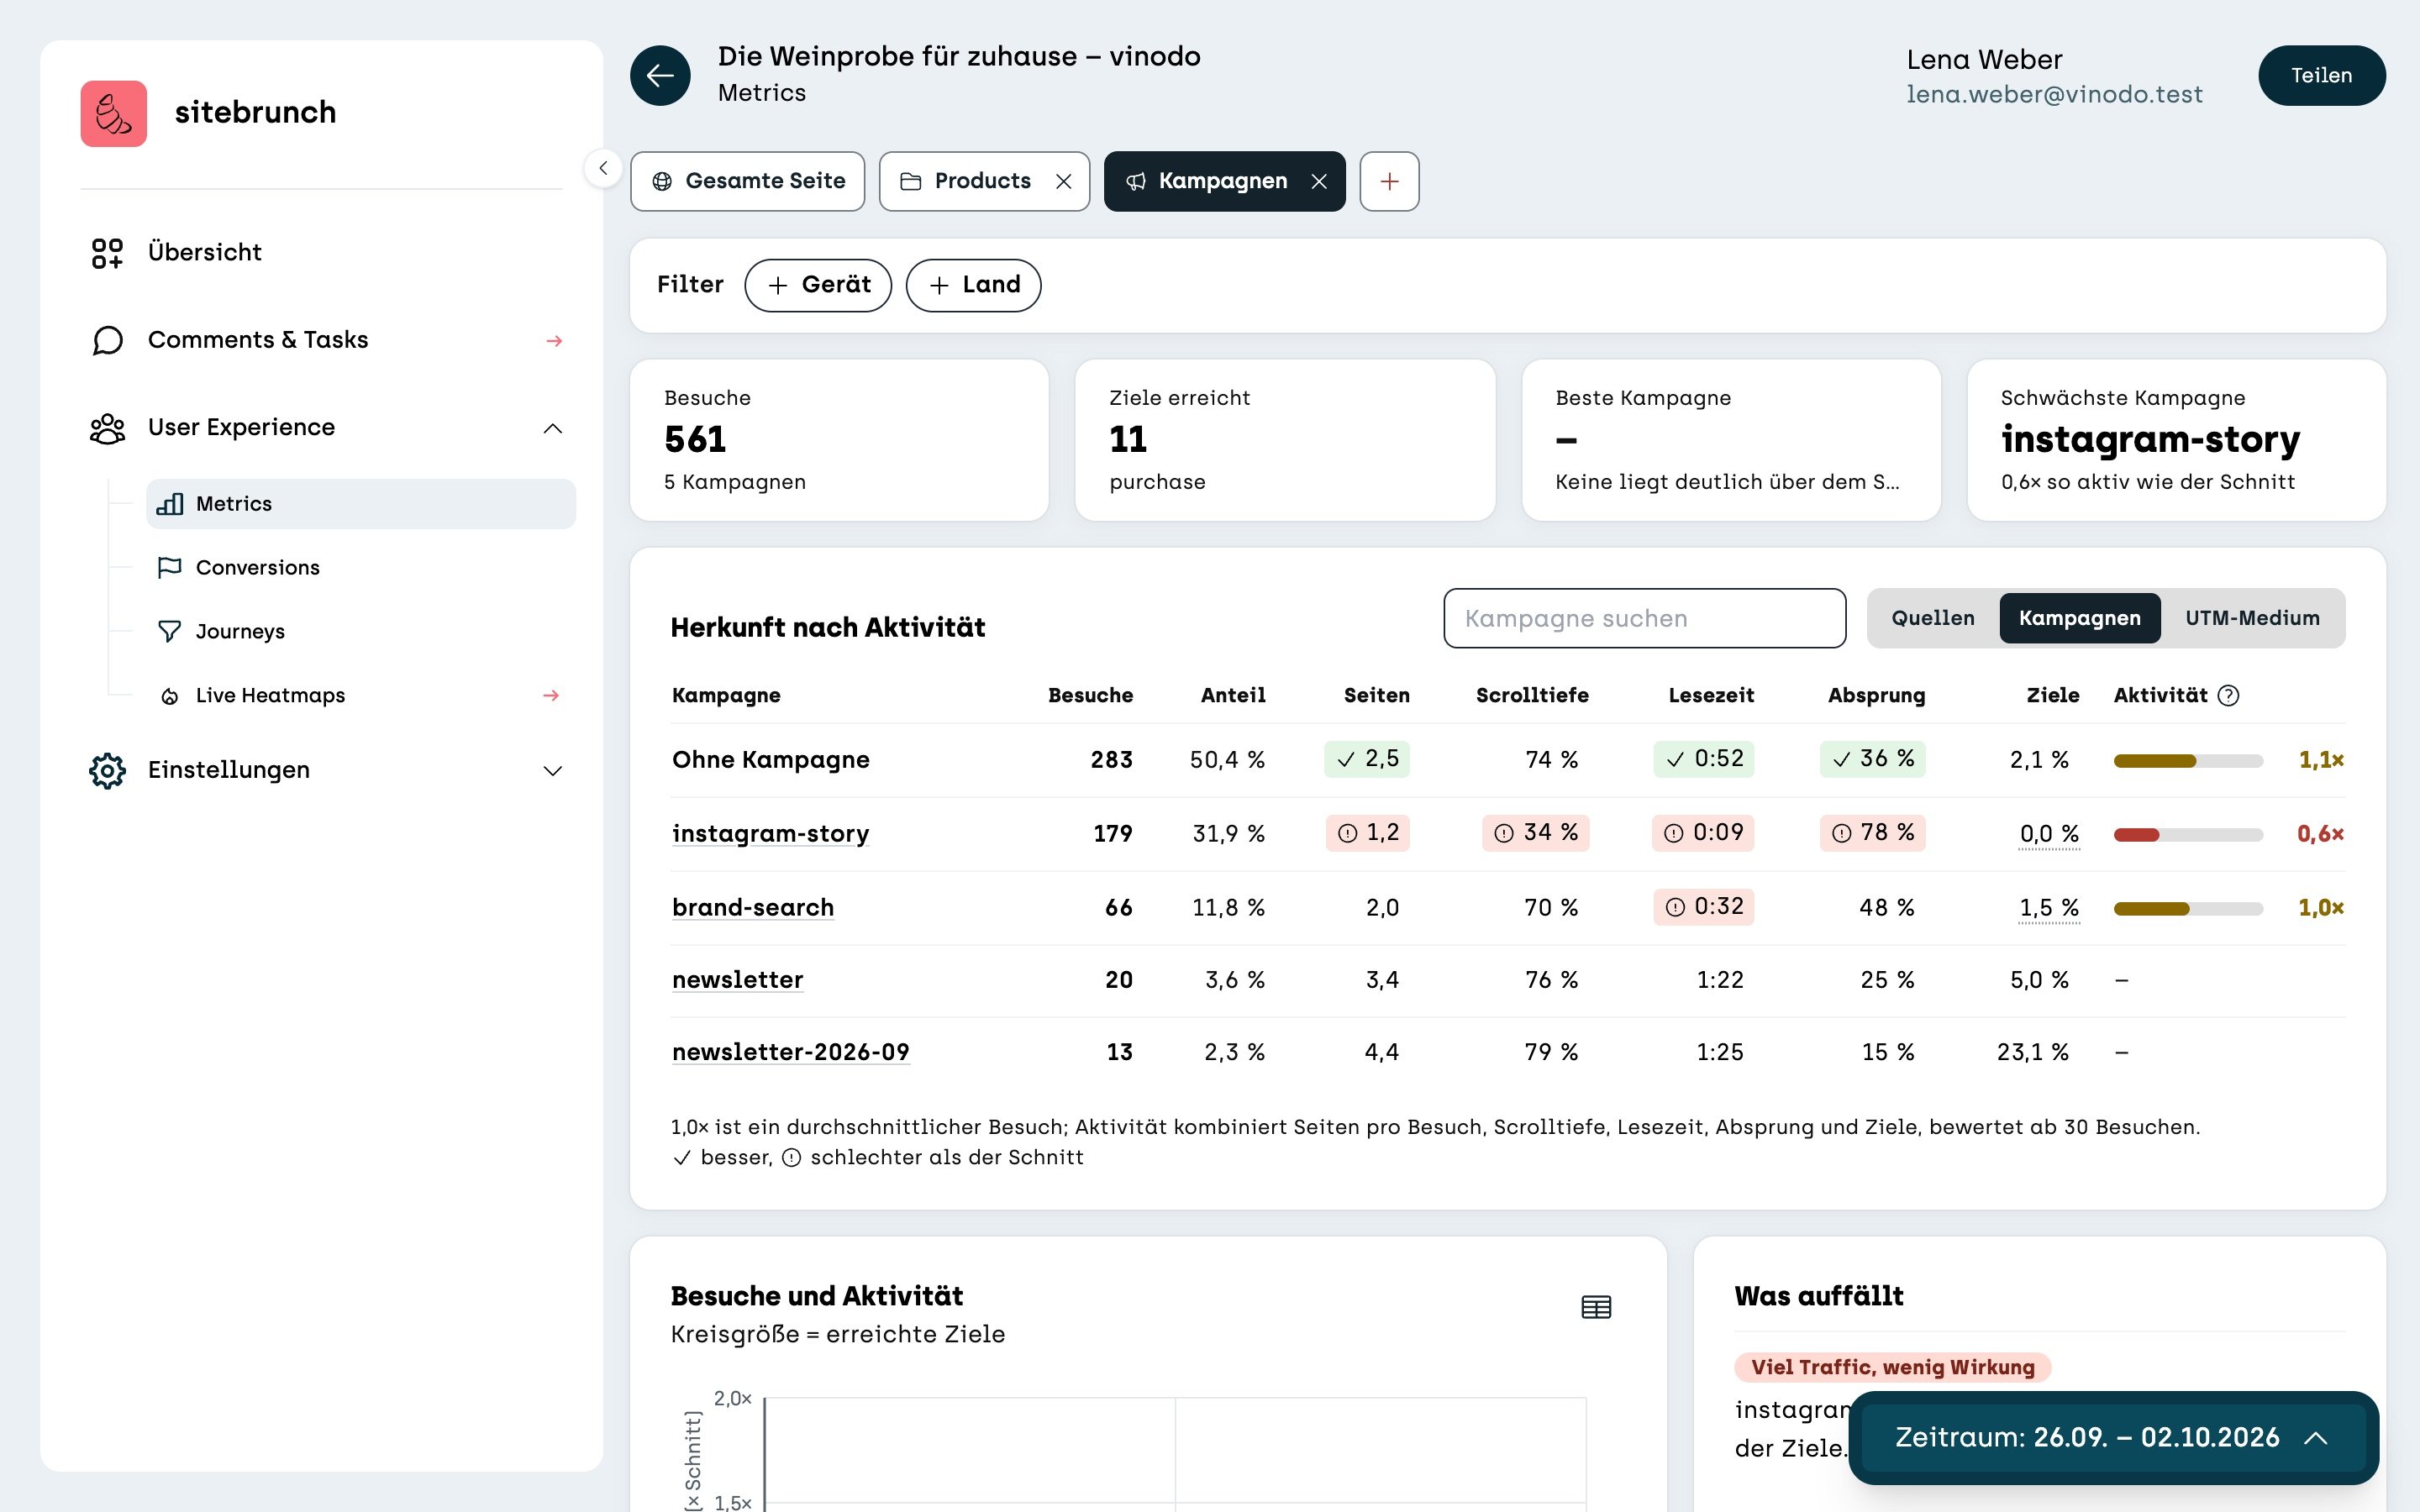
At the top right you switch between “Sources”, “Campaigns” and “UTM medium”. In the “Campaigns” view you see each campaign from your UTM links separately. Visits without a UTM link are listed under “No campaign”.
What stands out
At the very bottom, the “Visits and activity” chart shows each campaign as a circle. The further right, the more visits. The higher up, the more active. The bigger the circle, the more goals.
Next to it, “What stands out” sums up the key points in sentences. For vinodo.de, for example: “Lots of traffic, little effect” for the Instagram story.