
How often do visitors reach your goals, how much revenue does that bring and where do these visits come from? This article shows you the overview in Conversions.
Last updated: October 3, 2026
Requirements
You have created at least one goal.
Open the overview
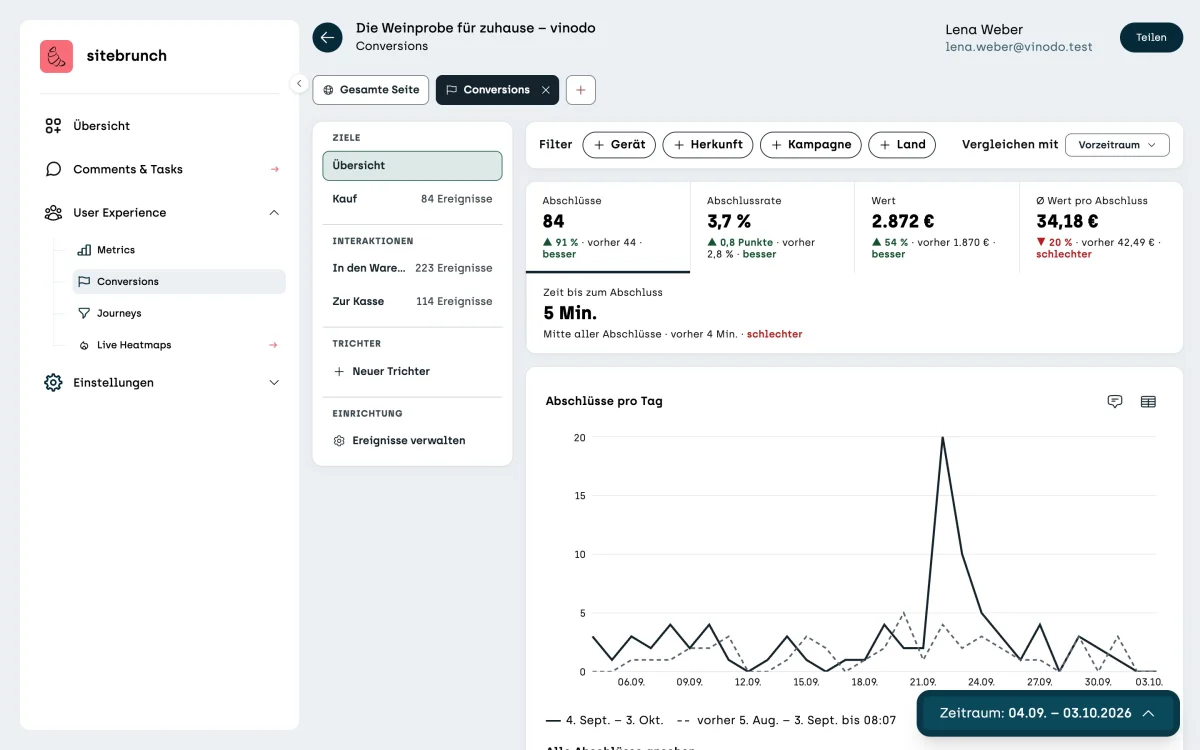
In the menu under “User Experience”, click “Conversions”. On the left you see your goals, interactions and funnels. At the very top is “Overview” with all goals together.
The tiles
“Conversions” counts how often a goal was reached.
“Conversion rate” is the share of visits that reach a goal.
“Value” is the revenue from all conversions, for example from purchases.
“Avg. value per conversion” is the average revenue per conversion.
“Time to conversion” shows how long a visit typically takes to reach the goal.
Below each number you see the comparison with the previous period, green for better and red for worse. On vinodo.de there were 84 purchases in the last 30 days, almost twice as many as before.
Filters, comparison and period work here just like in Metrics.
Where conversions come from
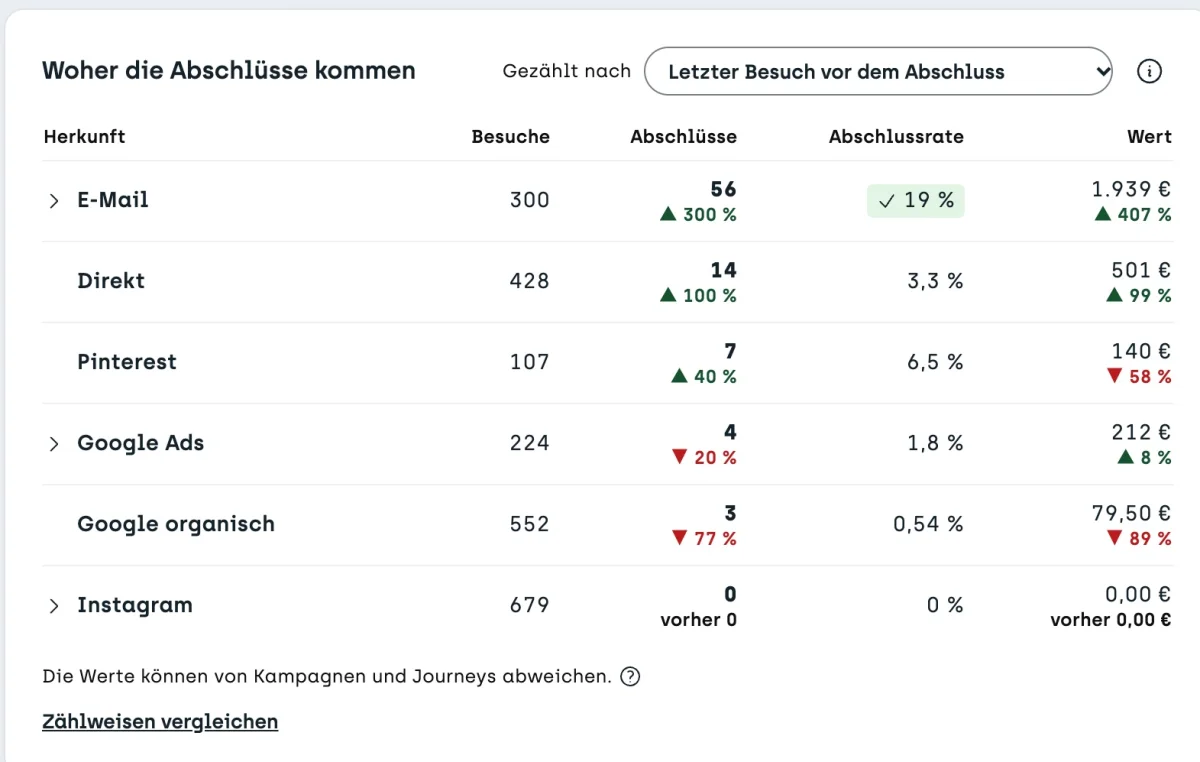
Below the chart you see which sources the visits with a conversion came from. On vinodo.de the newsletter brings the most purchases: 56 conversions at a conversion rate of 19%. Instagram brings many visits, but not a single purchase.
How conversions are counted
Some people come several times before they buy, for example first via Instagram and a week later via the newsletter. With “Counted by” you decide which visit gets the conversion:
“Last visit before the conversion”: the visit in which the purchase happened.
“First visit”: the visit through which the person first found you.
“All visits equally”: the conversion is split evenly across all visits.
“Later visits count more” and “First and last visit count more”: mixes of these.