Skip to content

Don't just count visits. See the effect.

See which sources and campaigns bring visitors who read, stay, and reach goals. And which ones only deliver traffic.

Everything you need

Activity

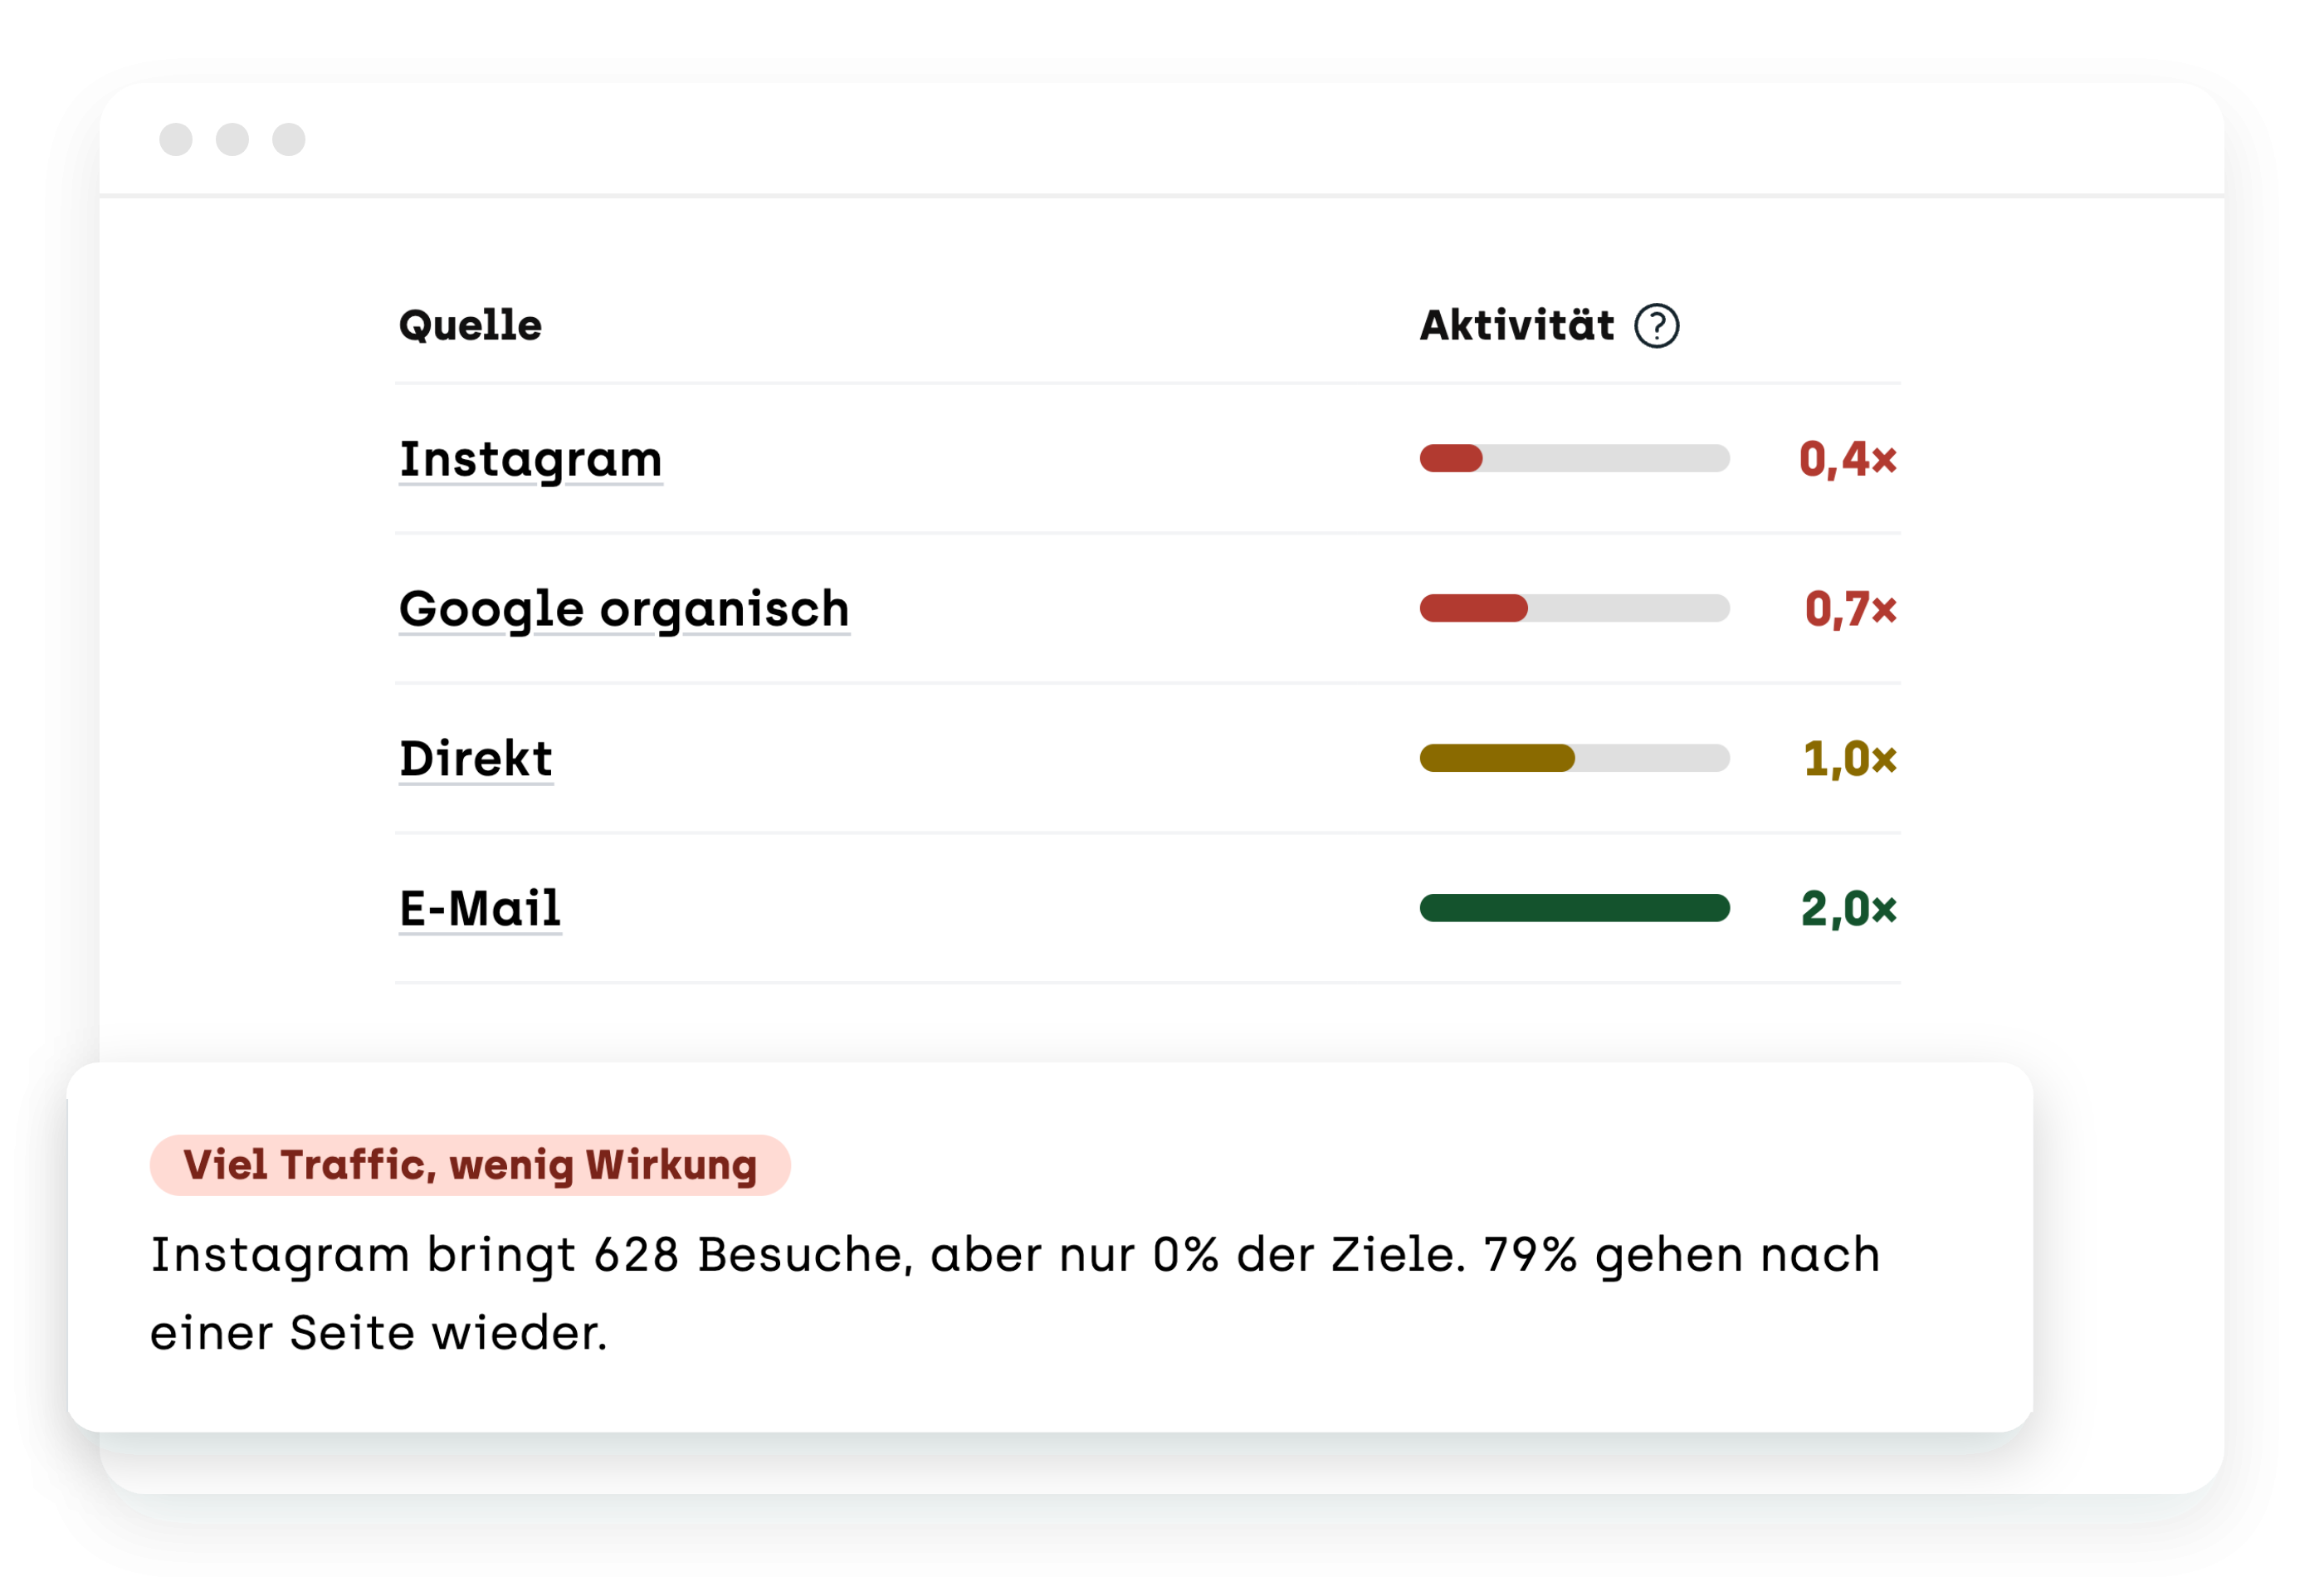
Activity, not just clicks

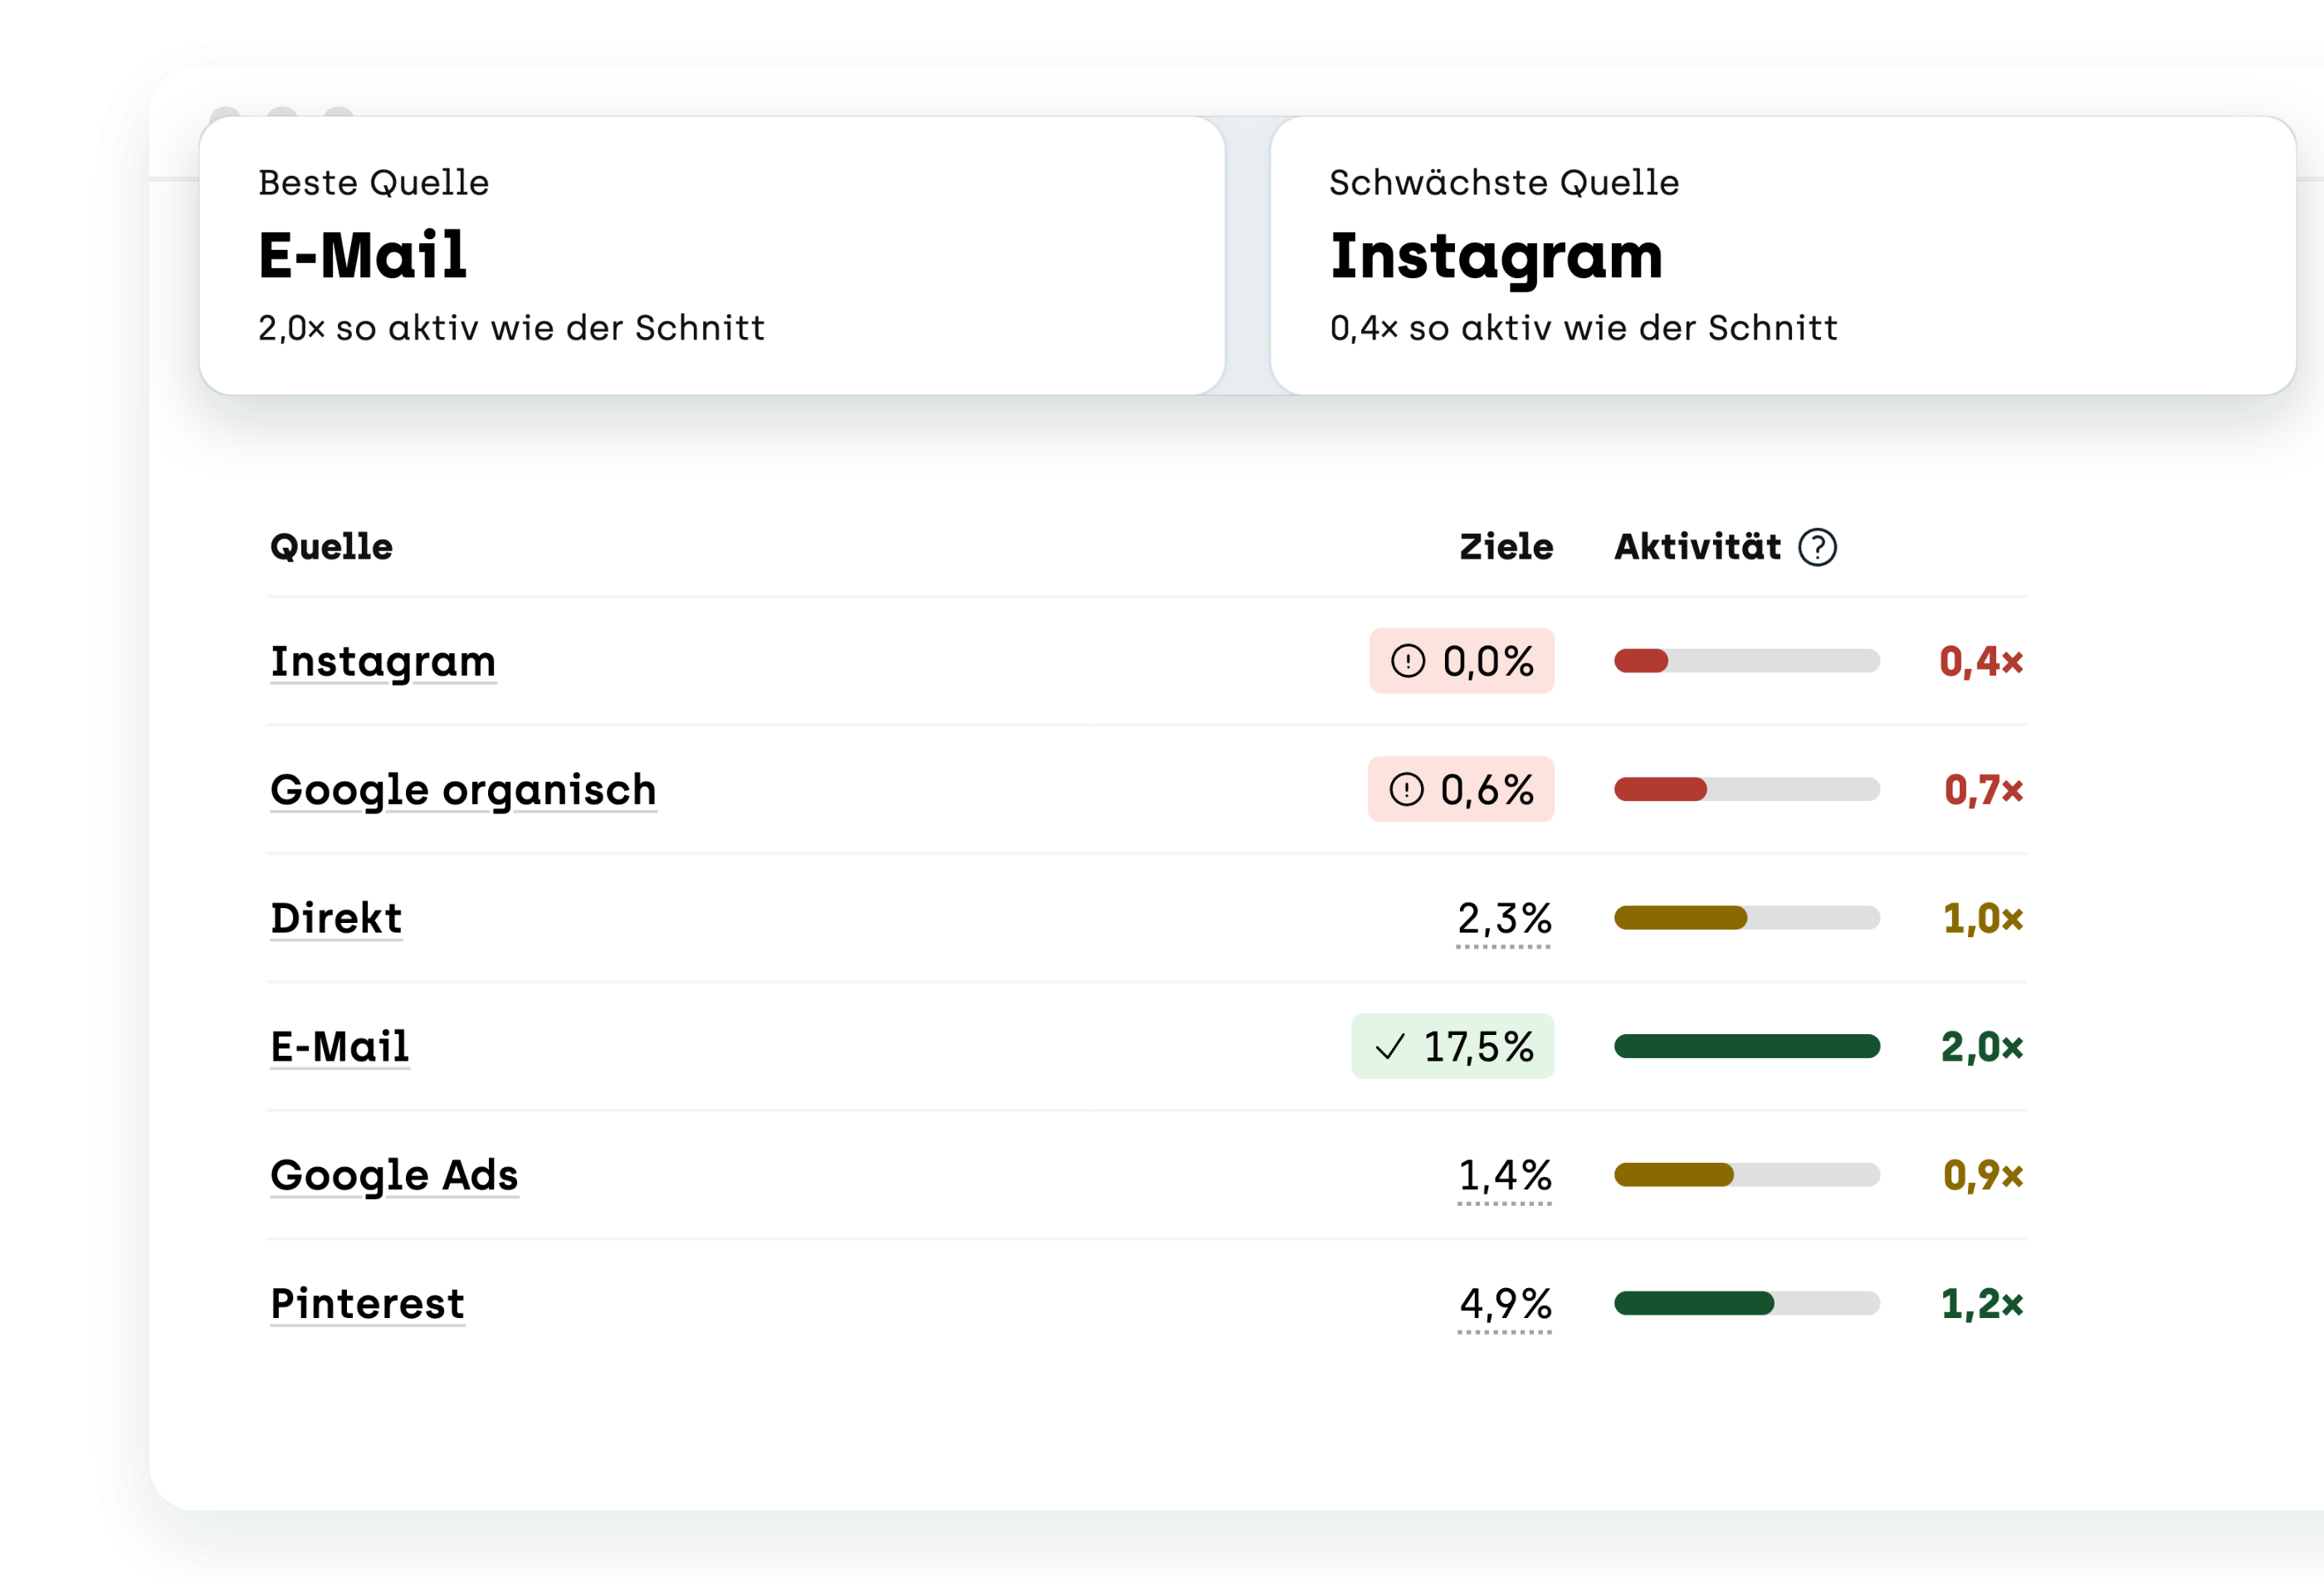
One value per source, made from goals, bounces, reading time, scroll depth, and pages per visit. Green is clearly more active than average, red clearly less.

Split by

Sources, campaigns, media

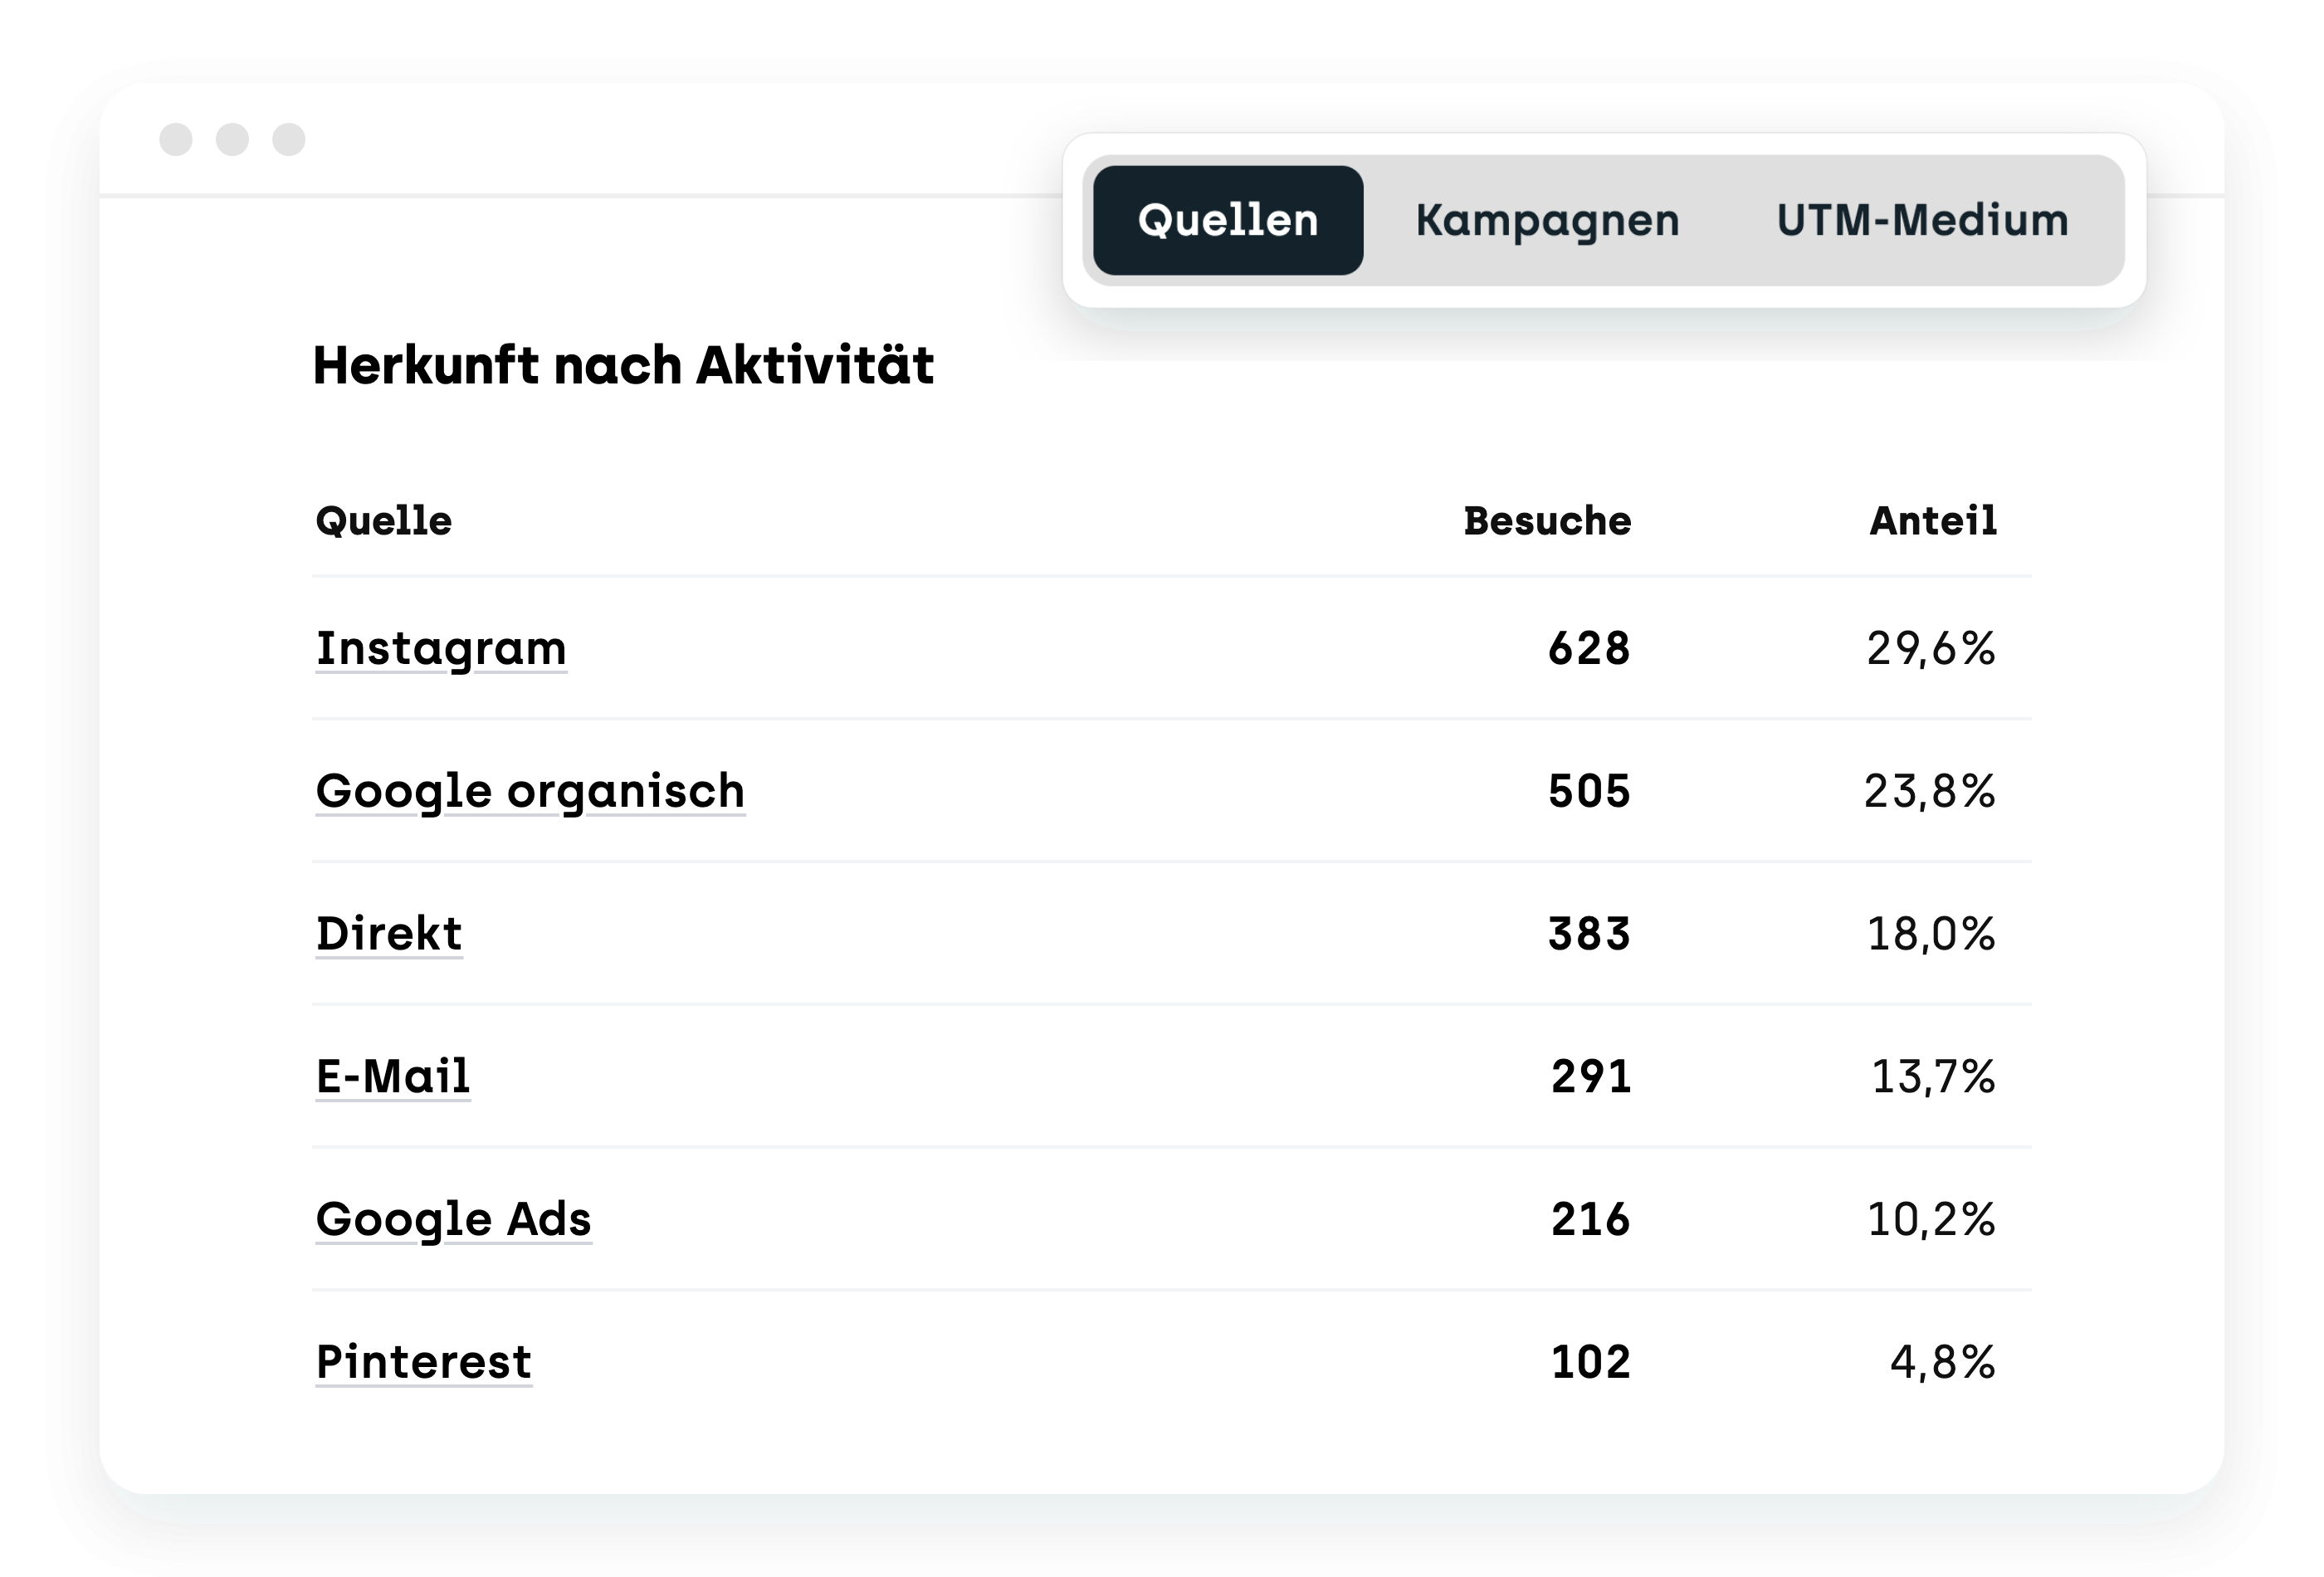
Switch with one click between sources like Google or your newsletter, your UTM campaigns, and UTM media.

Chart

Visits and activity

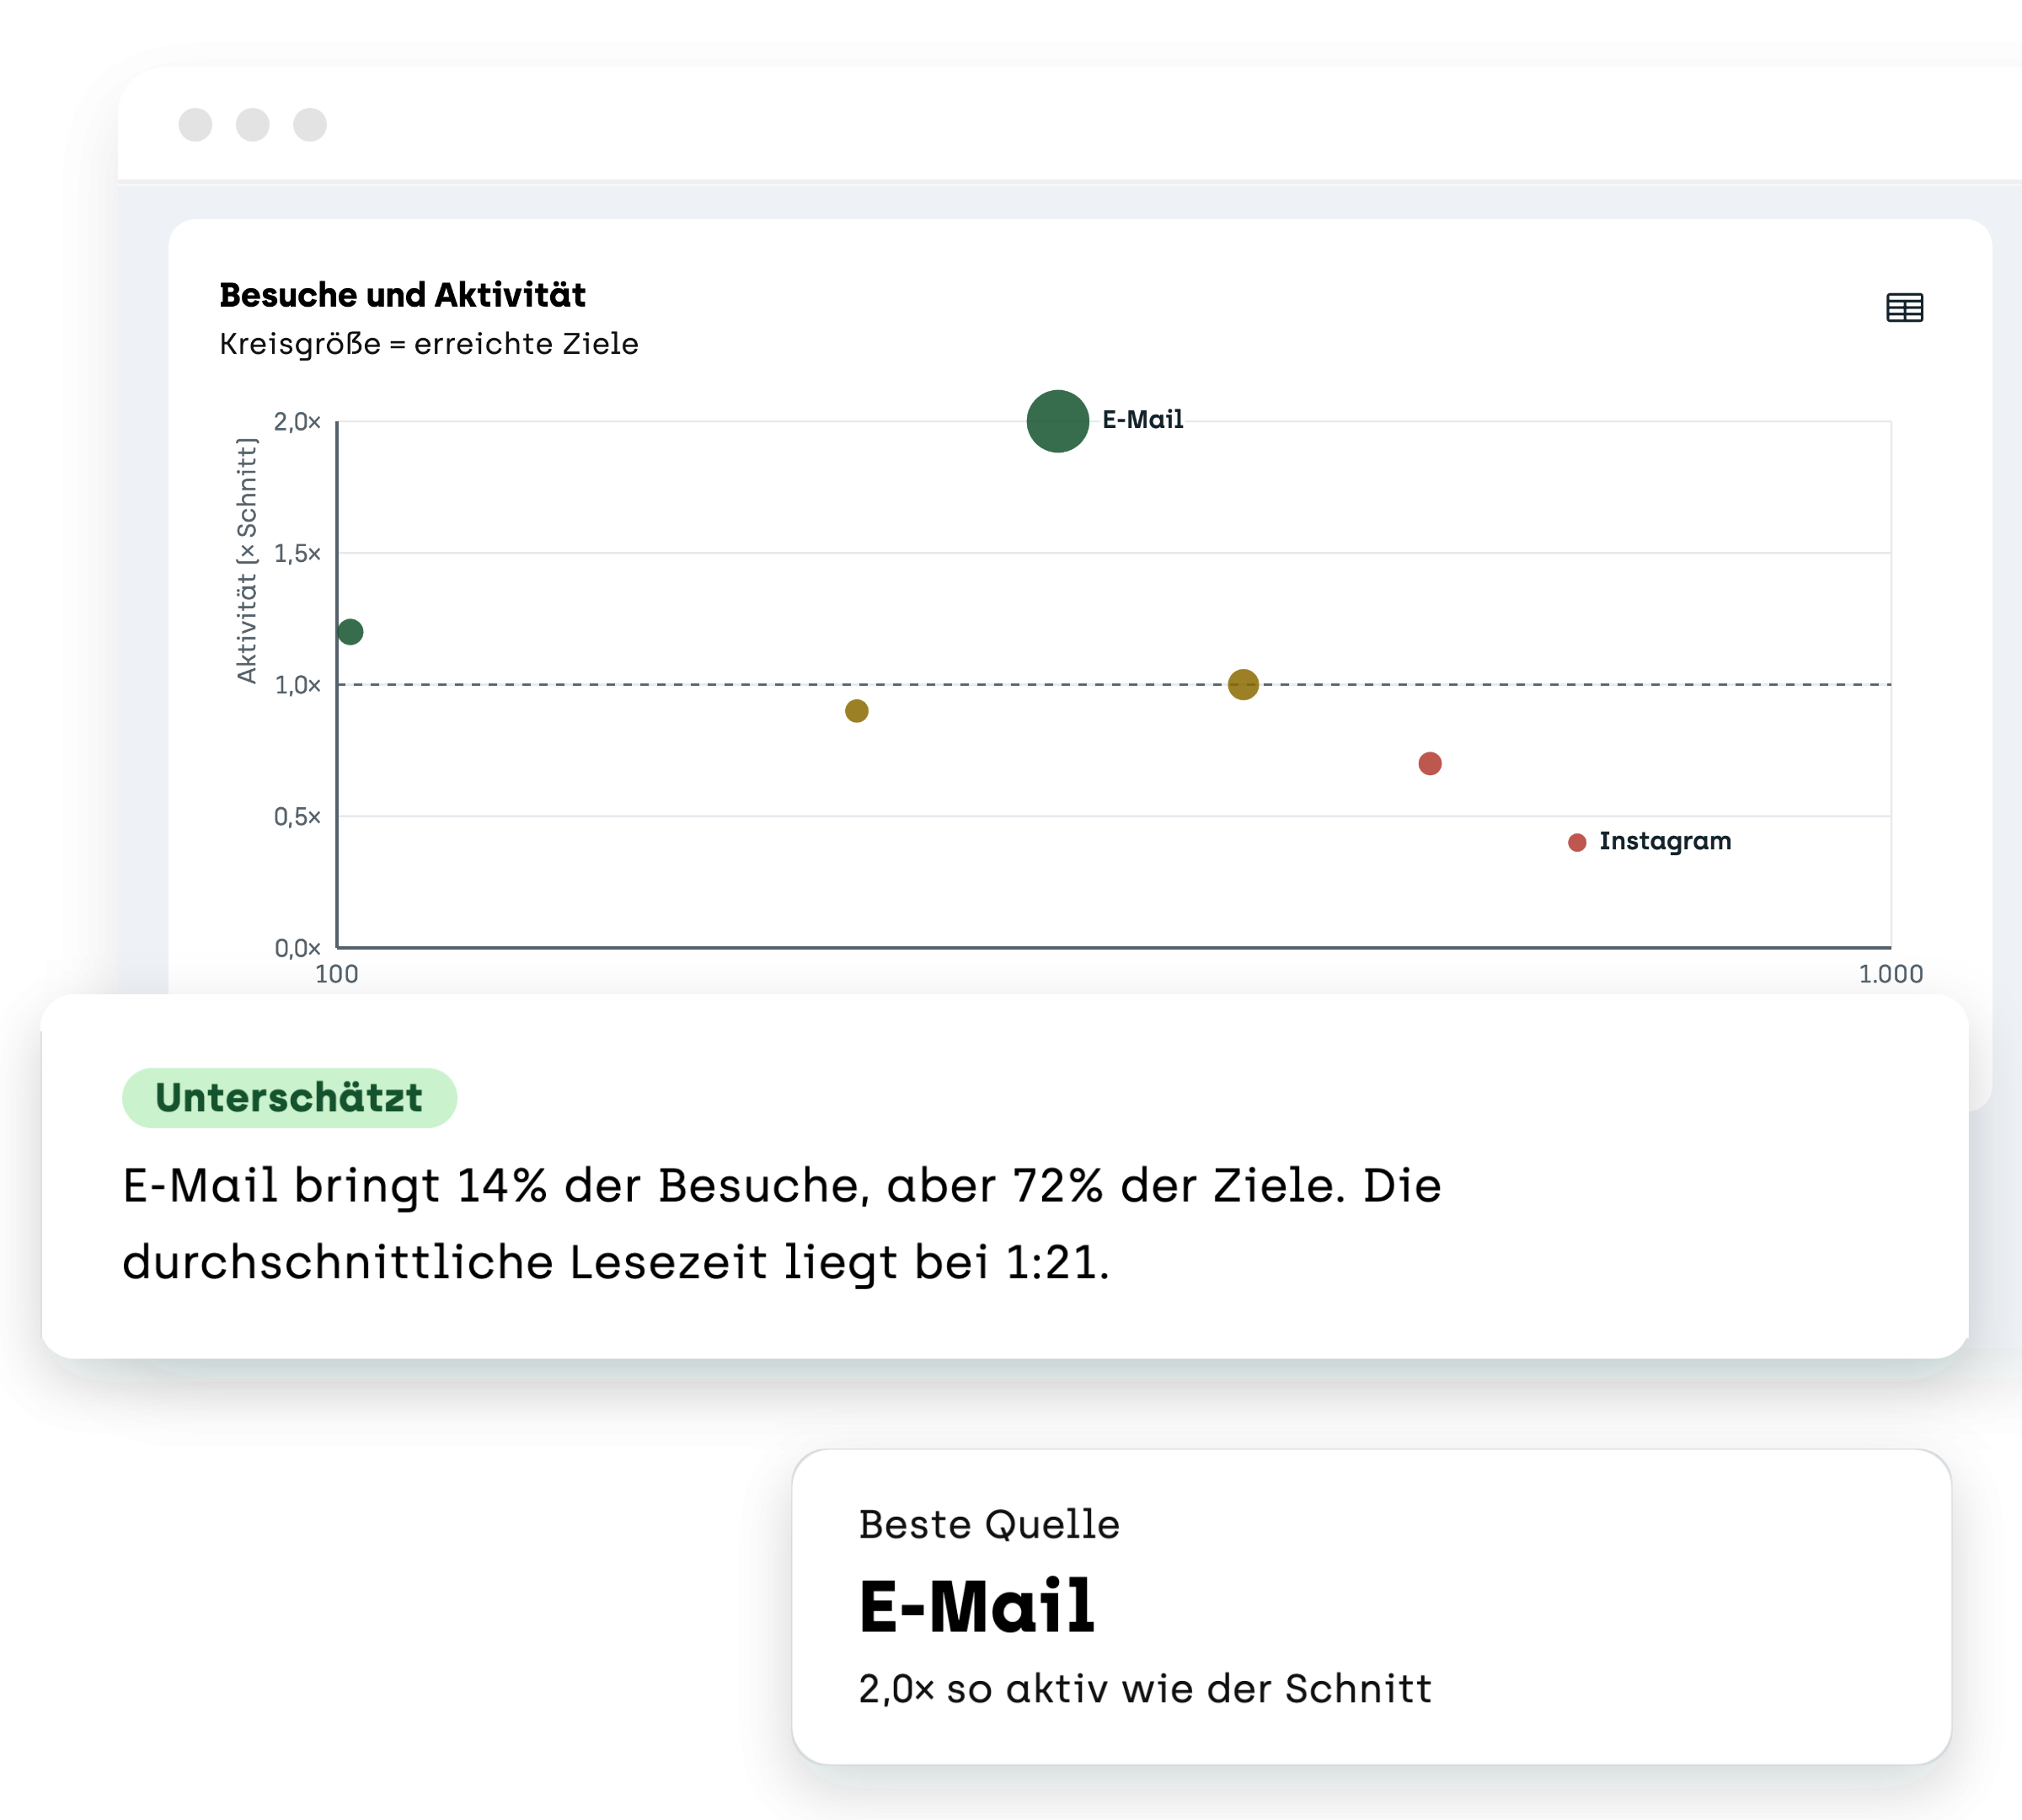
A chart plots visits against activity. The size of each circle shows the goals reached. Outliers stand out right away.

Findings

What stands out

sitebrunch tells you in one sentence which source is underrated, which one brings lots of traffic but little effect, and which one is worth growing.

Journeys

On to Journeys

From every source you open Journeys and see which pages these visitors look at next.

How it works

Ready to see which campaign works?

Compare your sources and campaigns by their real effect. Try every feature free for 30 days. The trial starts as soon as the code snippet is on your website.

Start your 30-day free trial (opens in a new tab)

Questions and answers