
With the “Start” view you see where visits from a campaign or source land and what happens next. This article shows you how, using a newsletter as the example.
Last updated: October 3, 2026
Requirements
The snippet is installed on your website.
There were visits in the selected period.
Add a starting point
A starting point is where a path begins: a source like Instagram, a campaign like a newsletter, a single page or a section.
In the “Start” view, click “Add starting point”. At the top, choose whether you want to see sources, campaigns, pages or sections. The list is sorted by visits in the period. Click “Add” next to the entry you want.
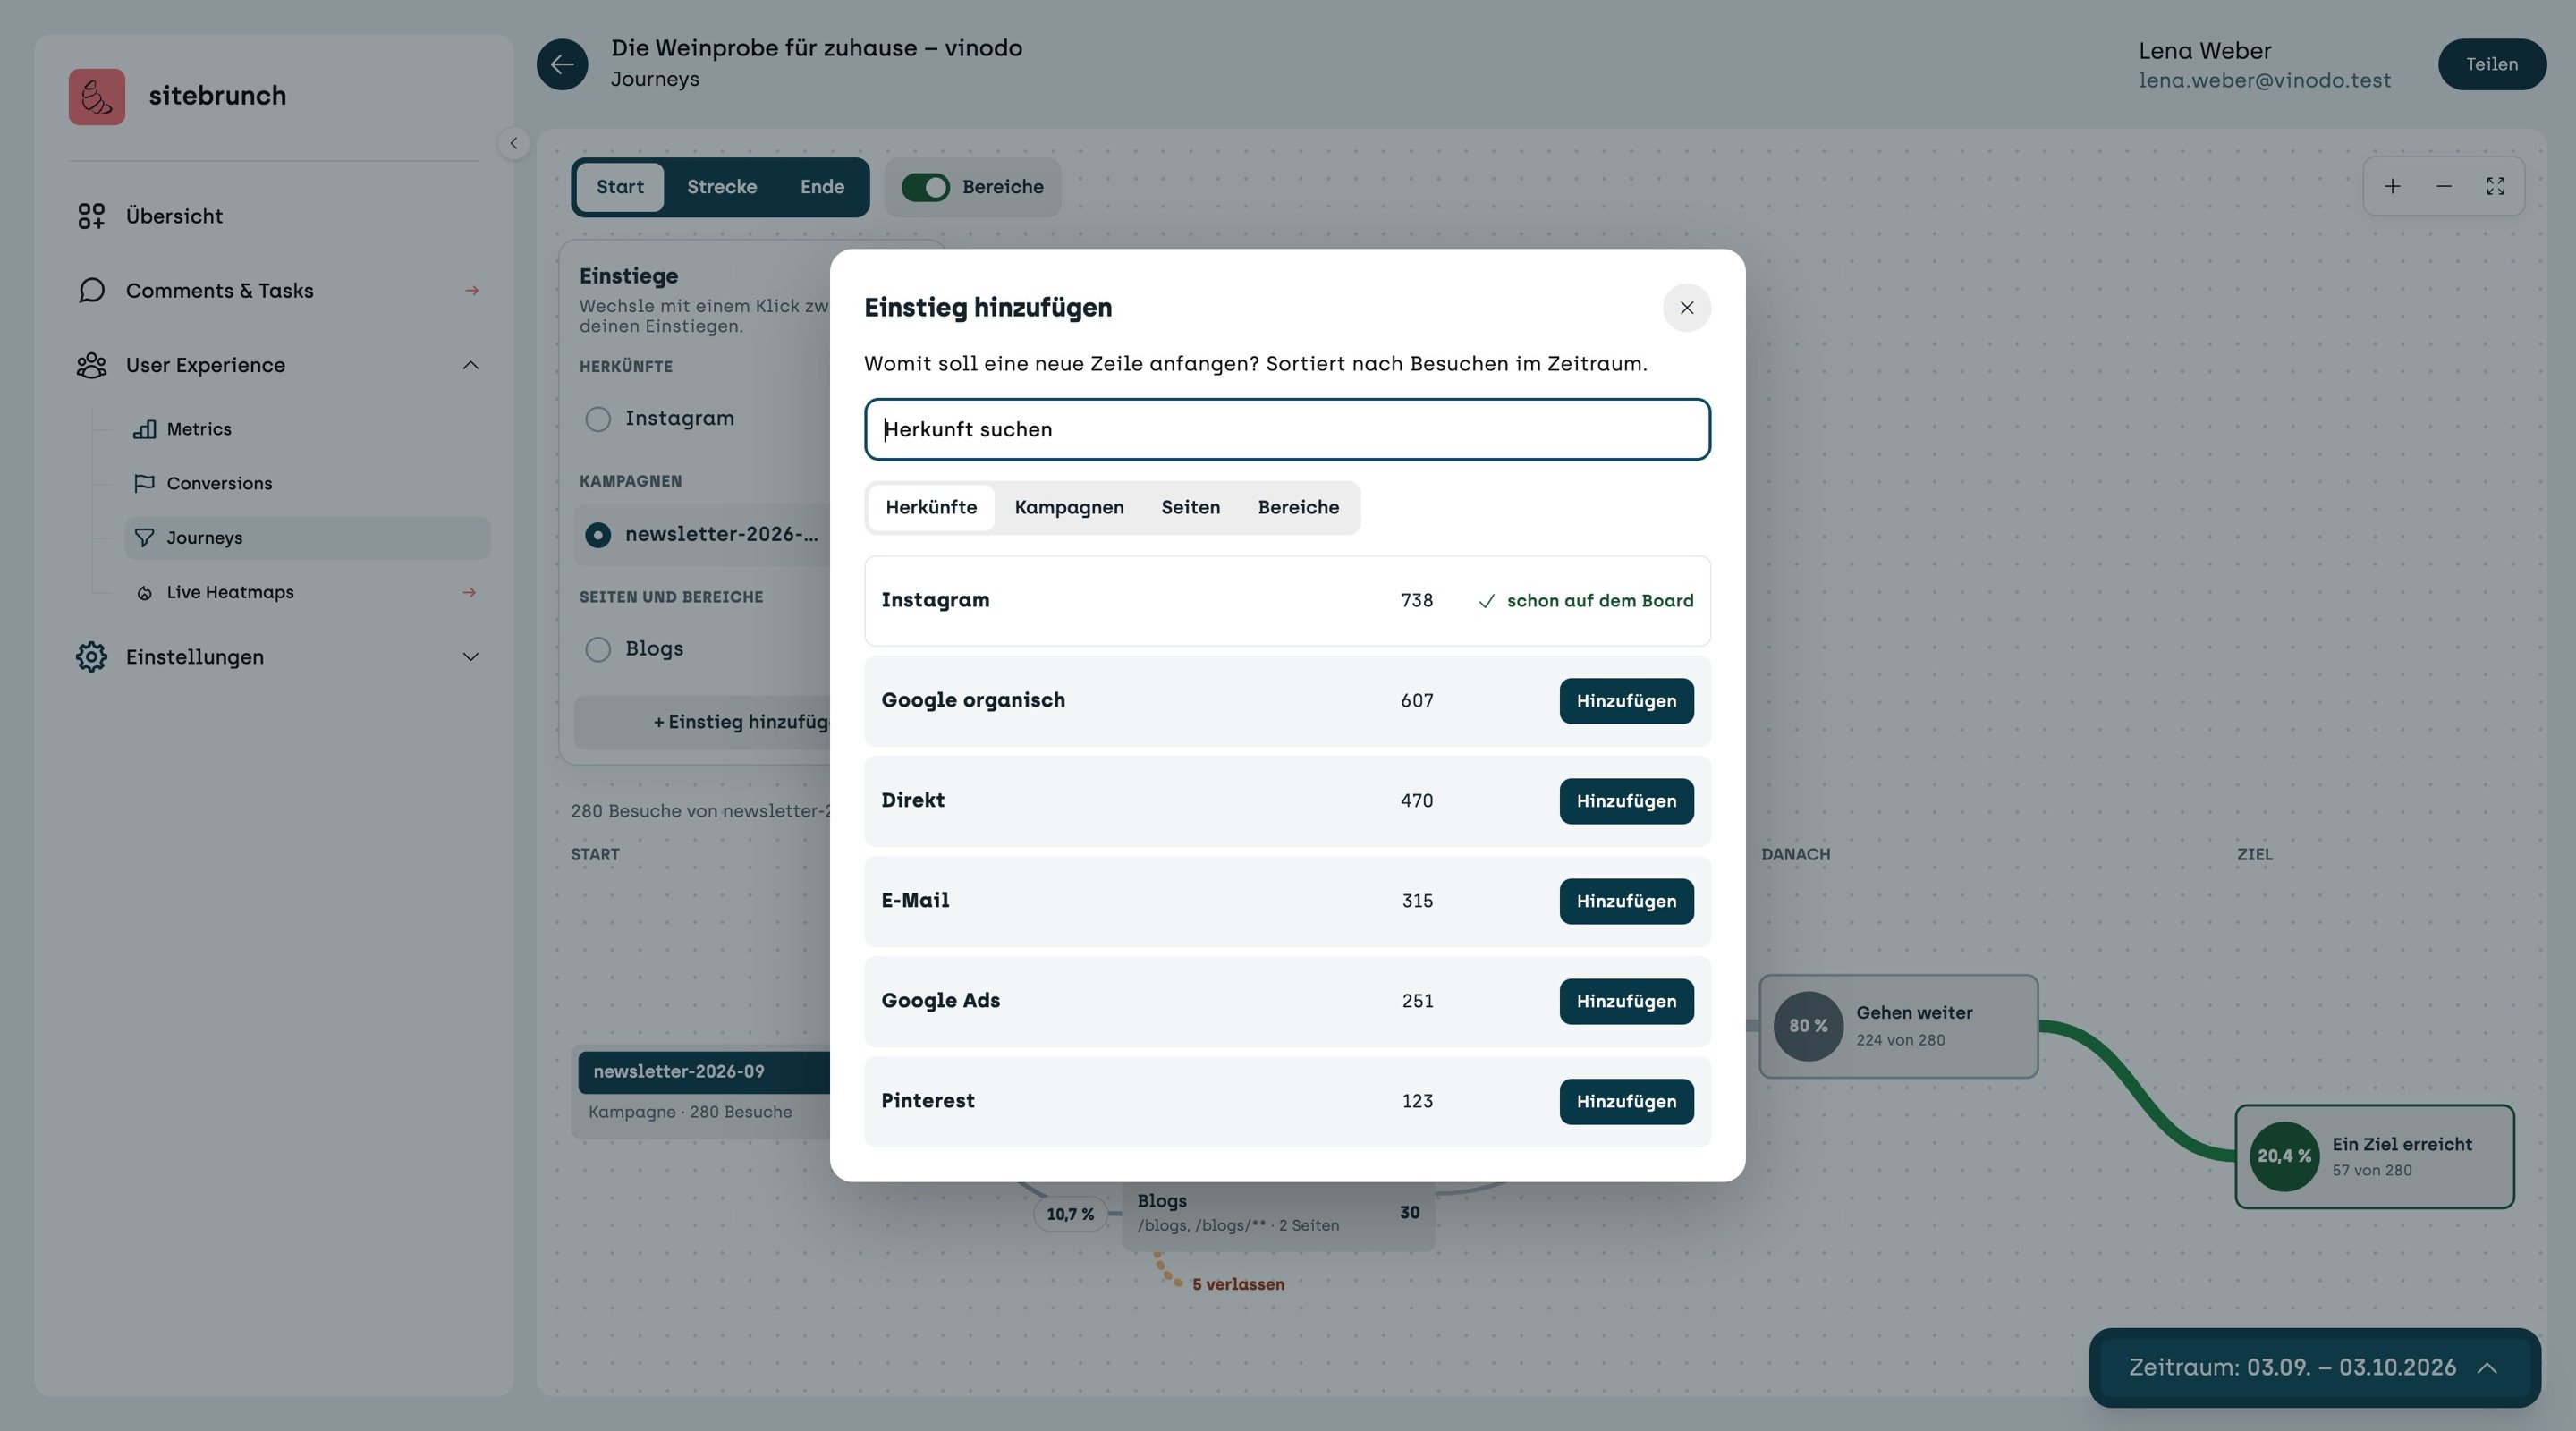
You can add several starting points one after the other. They then appear on the left in the “Starting points” list, and you switch between them with one click.
Read the board
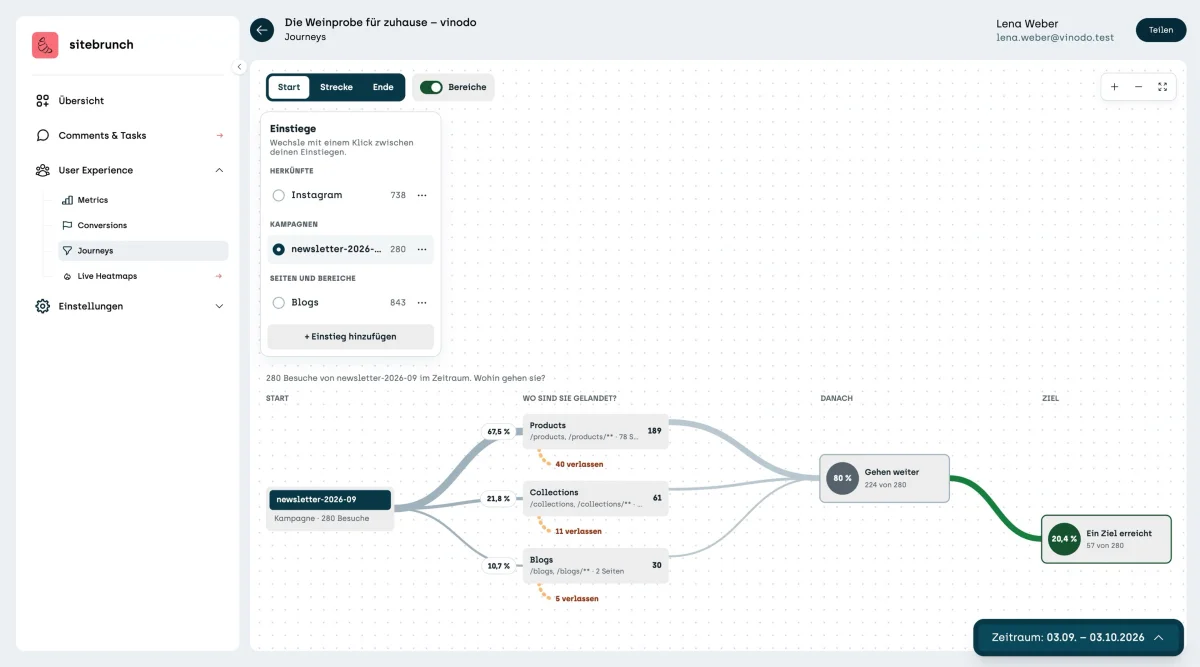
On the left is your starting point with the number of visits. On vinodo.de there are 280 visits through the campaign newsletter-2026-09.
The column “Where did they land?” shows the first page of the visits. The thicker the line, the more visits. Below each card, in orange, you see how many stopped there, meaning they left the website.
On the far right you see how many went on and how many reached a goal in the end. On vinodo.de, 80% go on after the first page and 20.4% buy something.
Follow a path further
Click a card or “Follow on” below it. The “Next step” column then opens. It shows which page the visits opened next. This way you go deeper step by step.
On vinodo.de, 189 visits from the newsletter land on a product page. 71 of them then look at another product, 41 read a blog article and 40 stop.
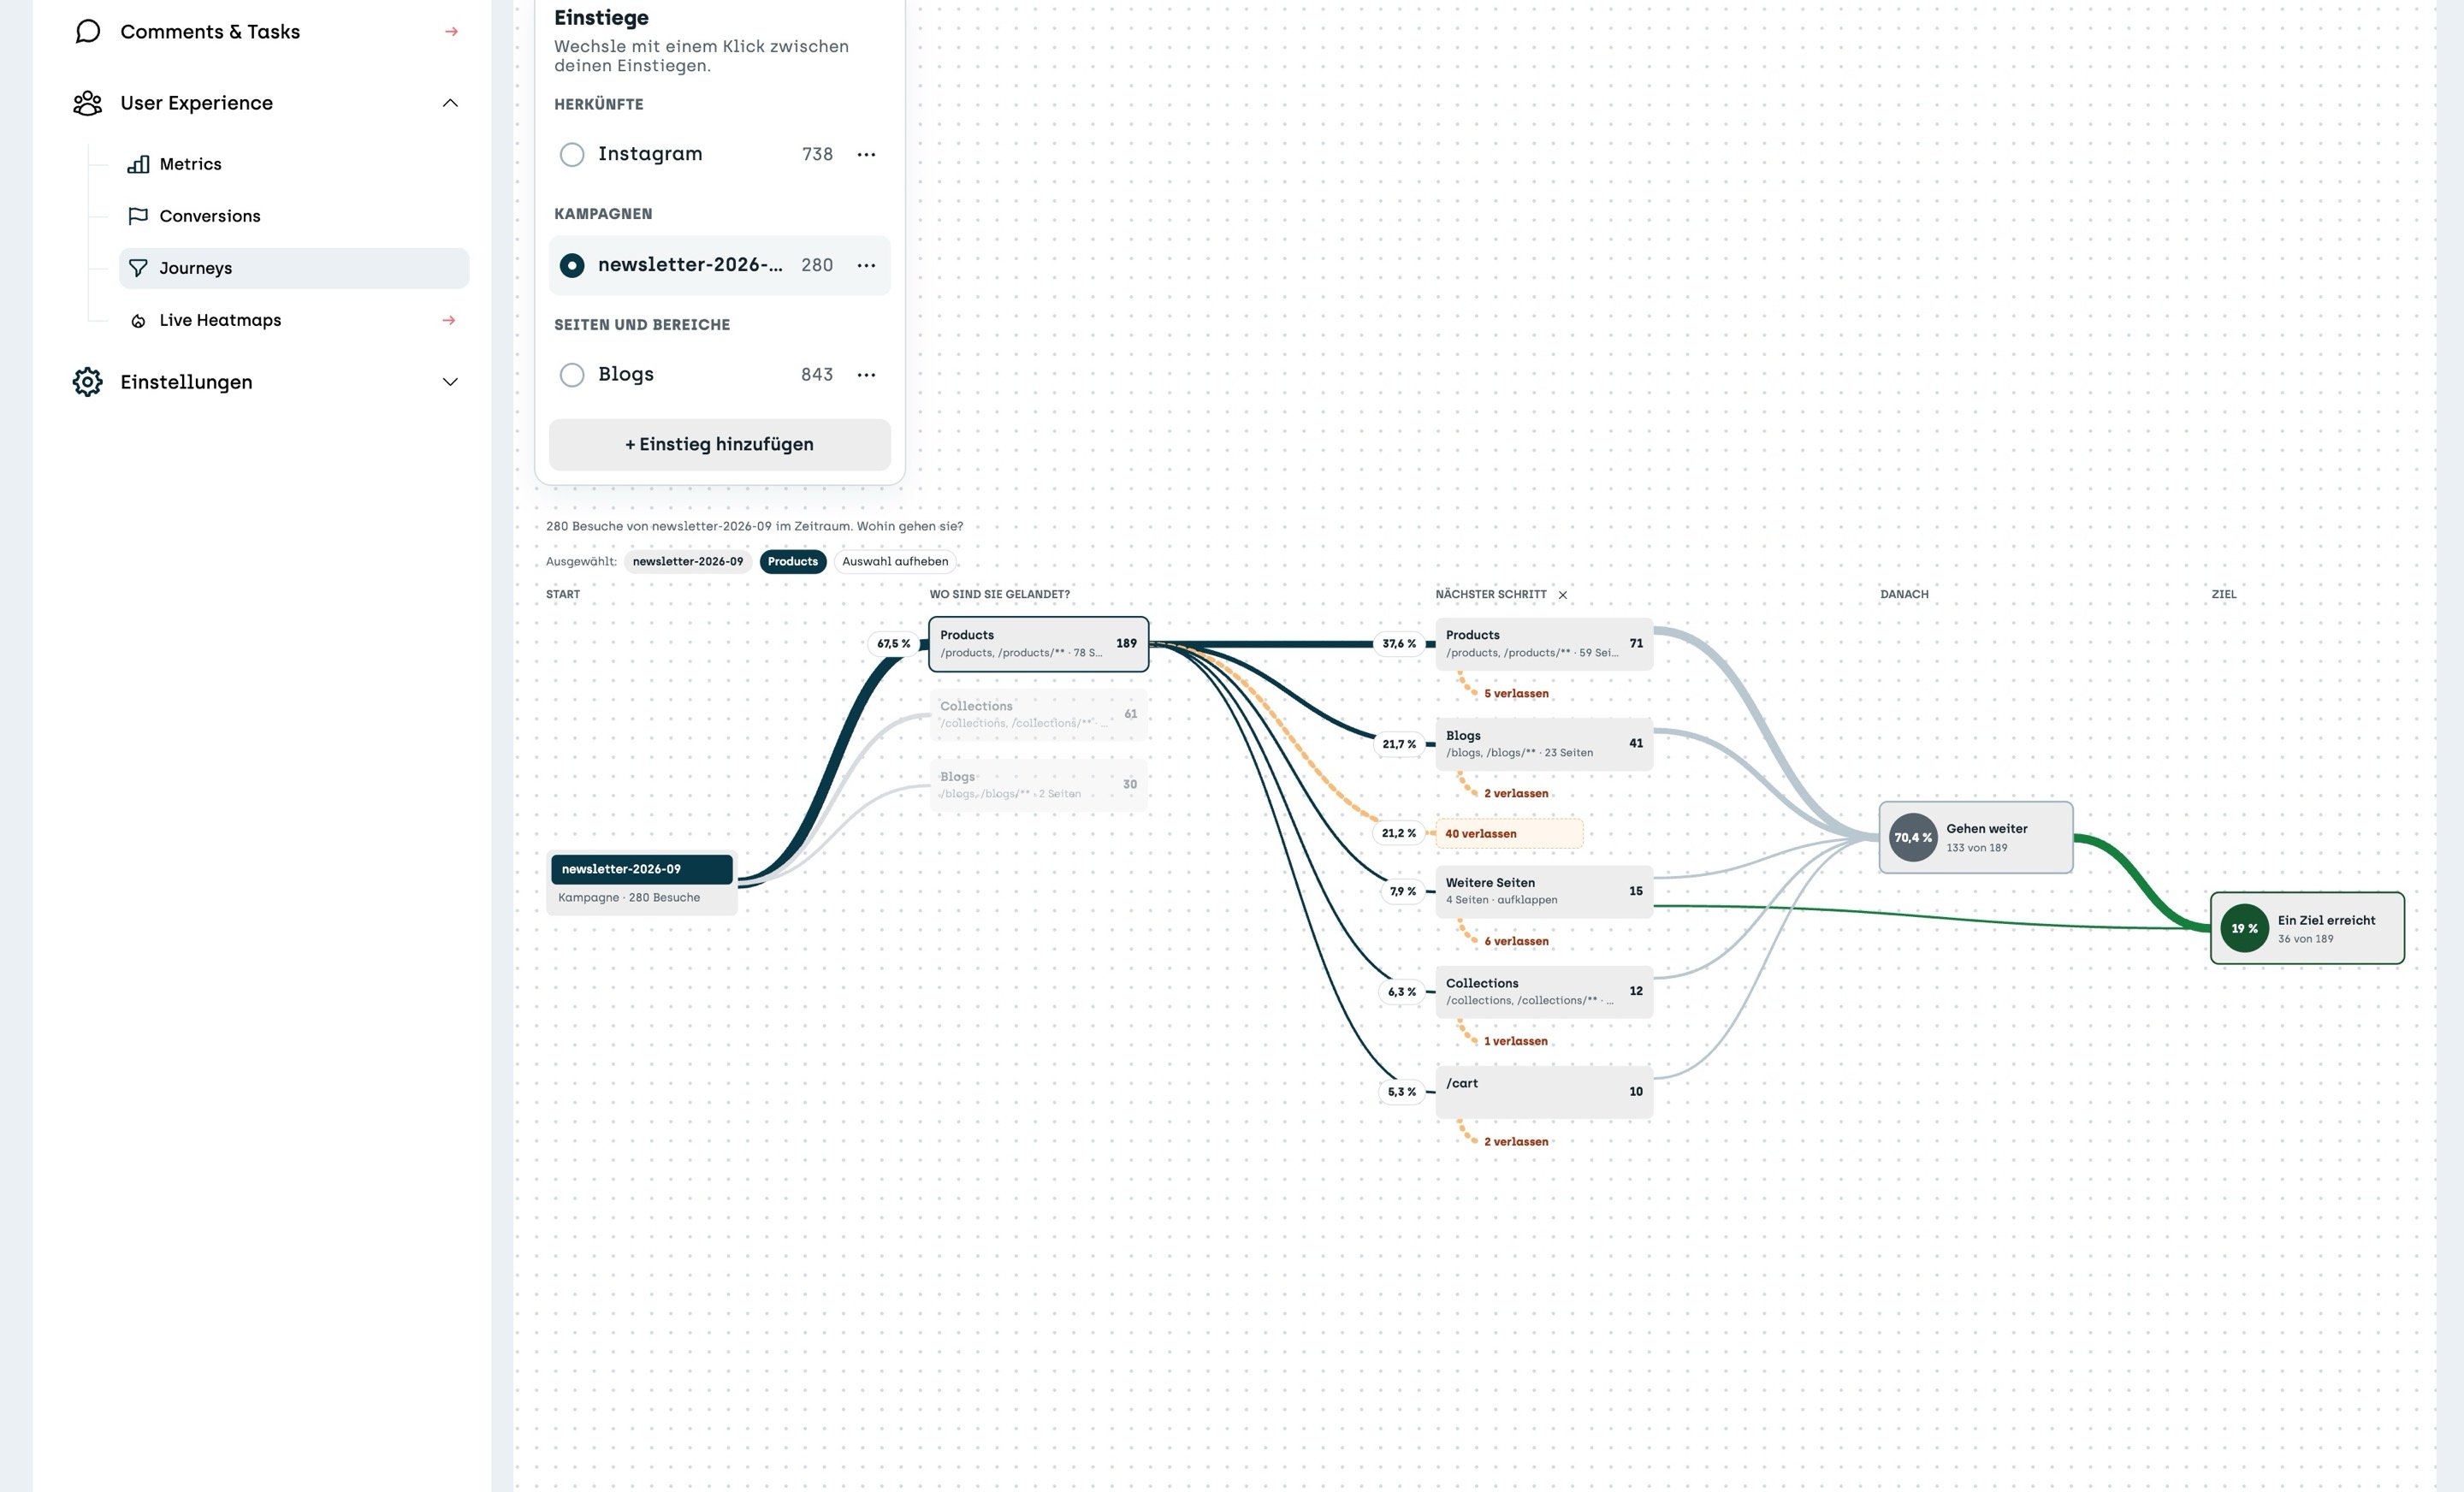
At the top you see what you have currently selected. Click an entry to jump back, or use “Clear selection” to start over. “Other pages” groups small pages together, and with “expand” you see them one by one.
Open directly from Metrics
You can also get to Journeys from Metrics. If you open a single page as a tab there, the “Journeys” button takes you straight to the paths starting from this page. In the campaign table, “view journeys” takes you to the paths of a campaign.
Starting points opened this way are not saved at first. Click “Keep” if you want them in your list.
To remove a saved starting point, use the three dots next to it and “Remove”.